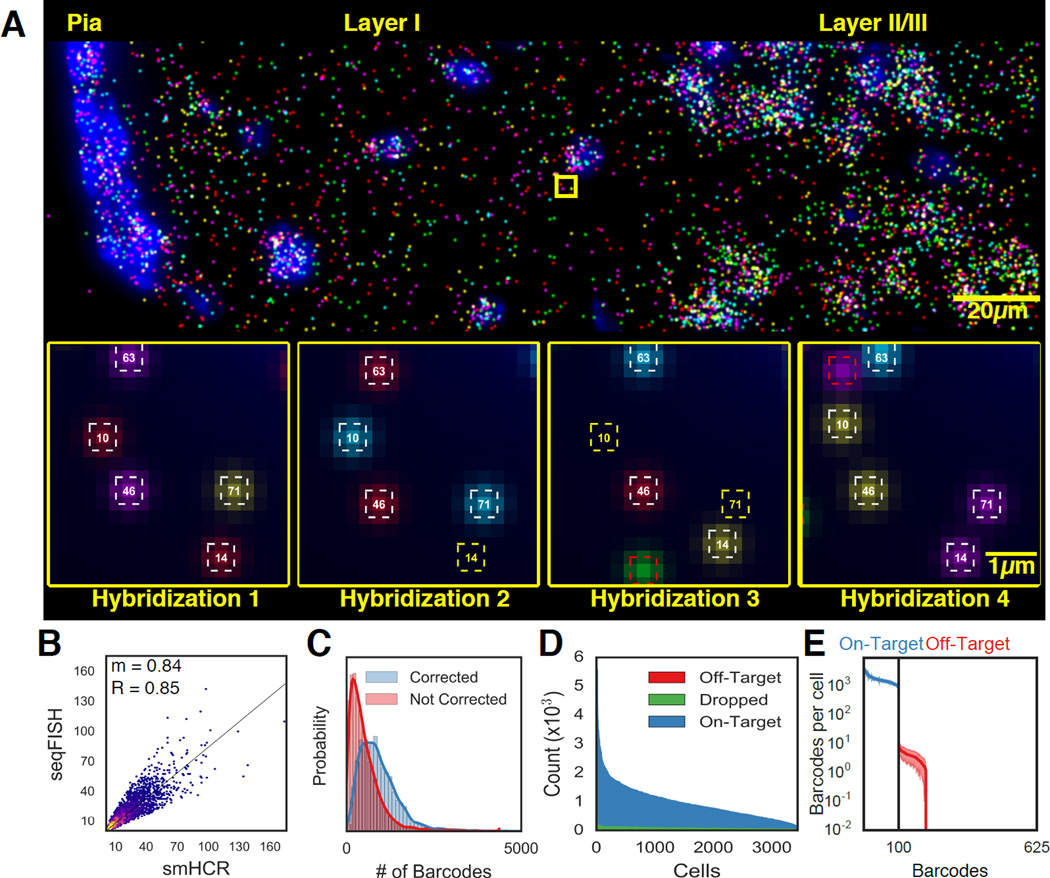
Fig. 2. seqFISH generate accurate in situ quantification of mRNA levels.
A. Image of seqFISH barcoding 100 genes in the outer layer of the mouse cortex. RNA dots in the image are z projected over 15µm. Individual mRNA points are shown across 4 hybridizations in the inset images. White squares correspond to identified barcodes, yellow squares correspond to missing transcripts in a particular hybridization, red squares correspond to spurious false positives and are not counted in any barcode measurements. Numbers in the squares correspond to barcode indices. B. seqFISH correlates with smHCR counts. After barcoding, 5 target mRNAs were measured twice by smHCR in the same cells, providing absolute counts of the transcripts. The two techniques correlate with an R=0.85 and a slope (m) of 0.84 (n=3851 measurements). The 2D histogram intensity shows the distribution of points around the regression line. A high density of points is seen along the regression line. The density falls off steeply around the regression line. C. Error correction results in a median gain of 373 (25%) counts per cell (n=3497). Red and blue curves correspond to the total barcode counts per cell before and after error correction. D. Dropped and off-target barcodes represent a small source of error in seqFISH. 100 on-target barcodes and 525 off-target barcodes are measured per cell. Dropped barcodes are due to at least two overlapping dots appearing within the same region. E. Off-target barcodes are rarely observed and contribute minimally to the expression profile in single cells. Each of the 100 on-target barcodes (blue) and 525 off-target barcodes (red) are quantified per cell. The mean is shown with shaded regions corresponding to 1 SD (N=41 imaged regions).

