Figure 5. Inter-patient variation in rosiglitazone effect. See also Figures S3-S7.
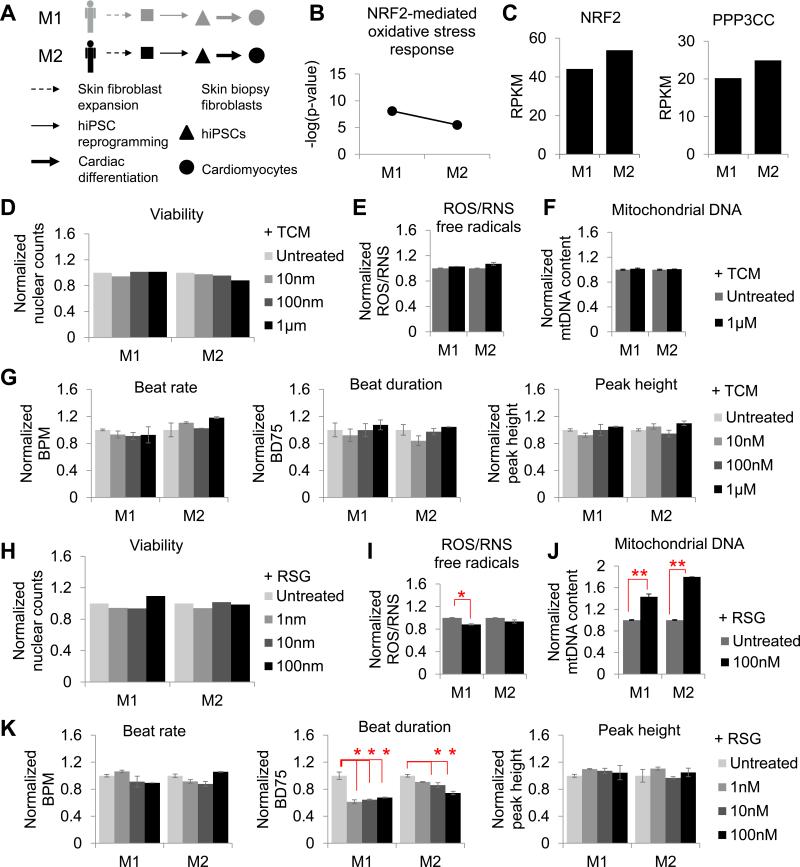
7-day treatment with 1 nM - 100 nM rosiglitazone in F1-F5 hiPSC-CMs did not affect (a) cell viability, (b) sarcomere length or periodicity of sarcomere protein distribution, or (c) sarcomeric organization. (d) Total production of free radicals (ROS/RNS) decreased in F1-F4 following 7 days of drug treatment, whereas in F5 ROS/RNS levels increased significantly (P < 0.05). (e) Mitochondrial DNA content also increased in F2-F4, but not in F1 or F5. (f) Beat rate and peak height were not affected, whereas beat duration (BD75) decreased at 7-days post-treatment with F1 showing the most moderate response (P < 0.05), and F5 showing no response. (g) Calcium imaging revealed that F5 did not respond to the beneficial effects of rosiglitazone towards improved contractility, as seen in F2 (decreased time to peak, TD90, and decay Tau; increased max rising and decay rates). (h) Correlation between our data and published literature, suggesting that reduced PPAR abundance encourages the PPAR-γ agonist, rosiglitazone, to bind non-specifically, thus increasing susceptibility to mitochondrial dysfunction. Y-axis represents data normalized to the untreated samples for each cell line. RU, relative units; BPM, beats per minute; BD75, 75% of beat duration; RSG, rosiglitazone.

