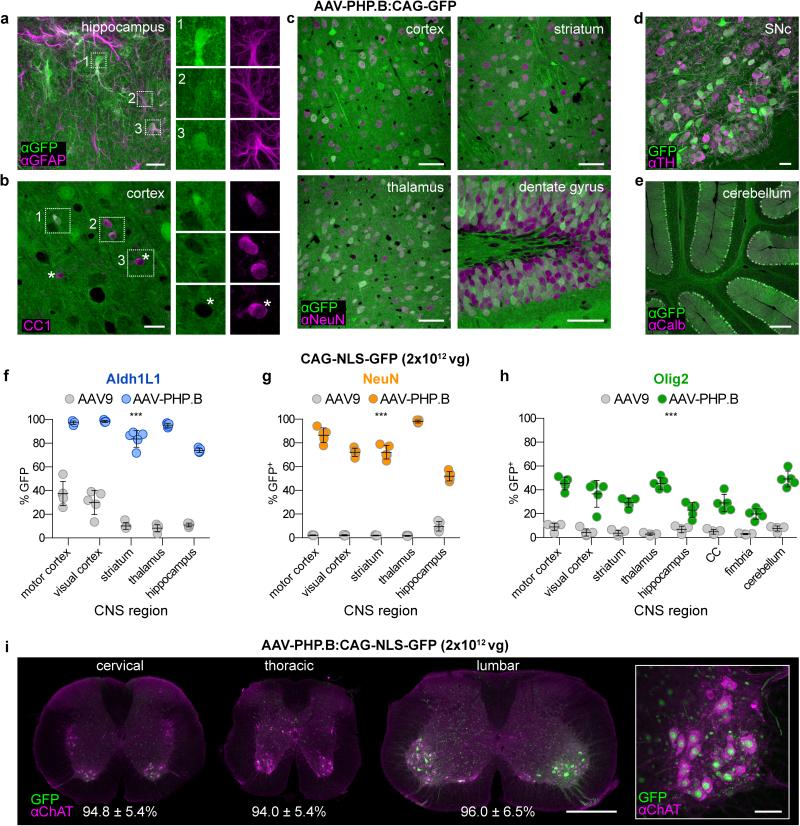
Figure 3. AAV-PHP.B transduces multiple CNS cell types more efficiently than AAV9.
(a-e) AAV-PHP.B transduces astrocytes, oligodendrocytes and neurons. Images show GFP expression 3 weeks after intravenous injection of 1×10¹¹ (a) or 1×10¹² (b-e) of ssAAV-PHP.B:CAG-GFP into adult mice. (a) MIP image of GFP (green) and GFAP (magenta) IHC in the hippocampus. (b) GFP and CC1 (magenta) IHC in the cortex. Numbered boxes highlight examples of double positive cells. Corresponding single-channel images are shown (right). Asterisks highlight cells without detectable GFP expression. (c) GFP and NeuN IHC in the indicated brain region. (d) MIP image of GFP fluorescence and TH IHC in the midbrain. (e) GFP and Calbindin (Calb) IHC in the cerebellum. (f-h) Quantification of the percentage of cells positive for NLS-GFP in the indicated brain region 3 weeks post injection. (i) AAV-PHP.B transduces ChAT+ spinal motor neurons. Images show native NLS-GFP fluorescence and IHC for ChAT in whole transverse spinal cord sections (left) or ventral horn MIP image (right). The percentage of ChAT+ neurons that expressed NLS-GFP in each spinal cord region is given ± the 95% confidence interval. For quantification, n=5 per group; mean ± s.d; All pairs of AAV9 vs AAV-PHP.B means were found to be different (***p<0.001) unpaired t tests corrected for multiple comparisons by the Holm-Sidak method. Scale bars: 20 μm (a,b,d), 50 μm (c,i, right), 200 μm (e) and 1 mm (i, left).

