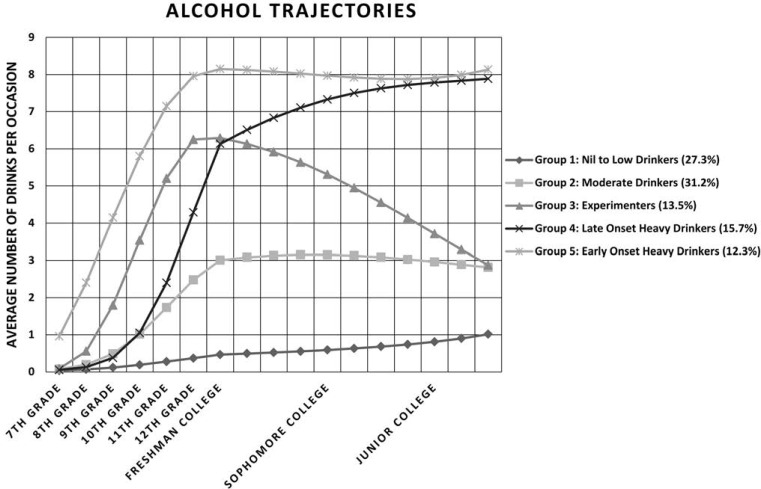
Figure 1.
Alcohol use trajectories. Y-axis represents average amount of alcohol consumed per drinking occasion. One drink means 1 beer, 1 shot of distilled spirits, or one glass of wine. X-axis represents periods from the first assessment in seventh grade through junior year in college. The first 6 periods are yearly. Periods after college matriculation are every 3 months.

