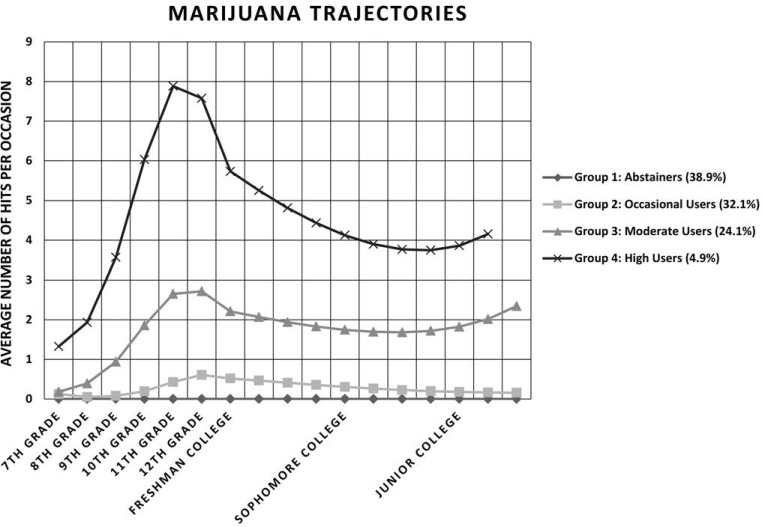
Figure 2.
Marijuana use trajectories. Y-axis represents average number of hits of marijuana consumed per smoking occasion. One hit is equal to 1 joint, bong, or pipe hit. X-axis represents periods from the first assessment in seventh grade through junior year in college. The first 6 periods are yearly. Periods after college matriculation are every 3 months.

