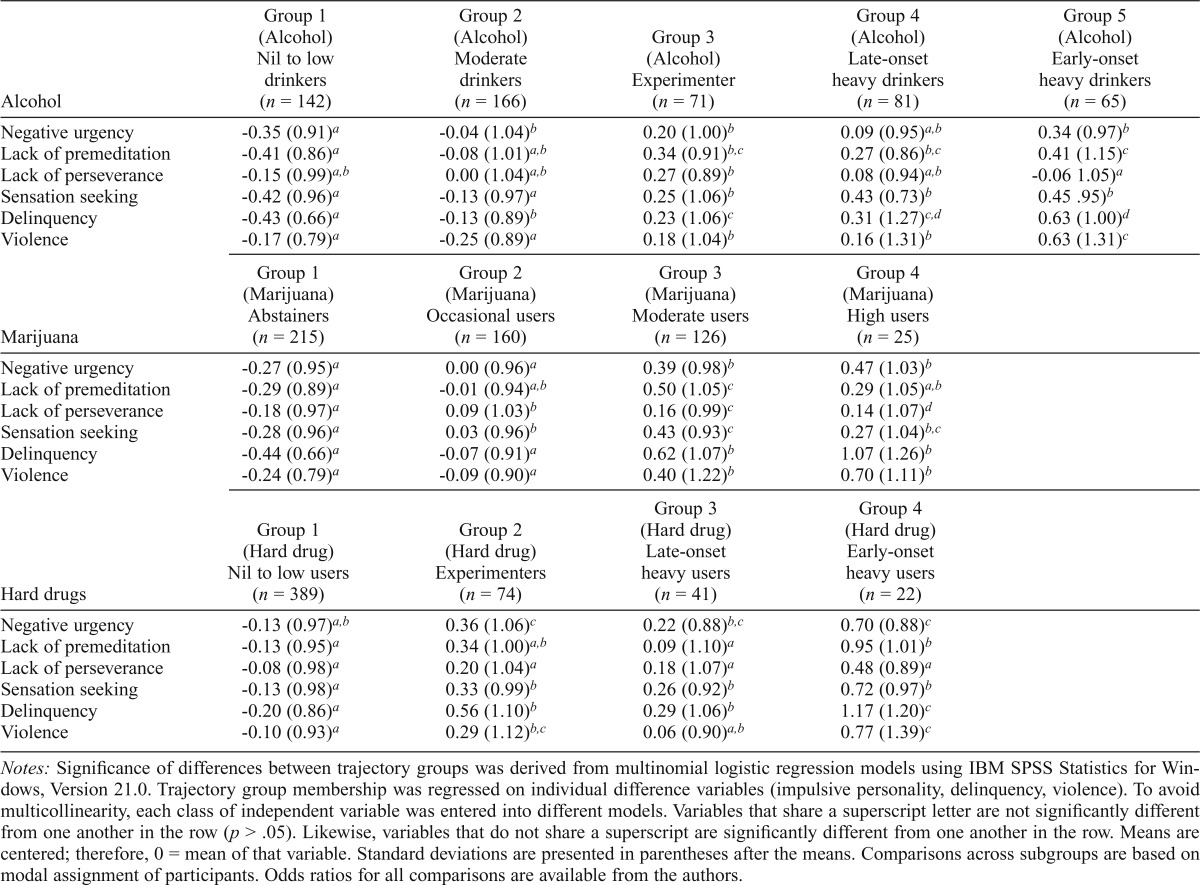
Table 5.
Relations between trajectories and covariates using multinomial logistic regression
| Alcohol | Group 1 (Alcohol) Nil to low drinkers (n = 142) | Group 2 (Alcohol) Moderate Drinkers (n = 166) | Group 3 (Alcohol) Experimenter (n = 71) | Group 4 (Alcohol) Late-onset heavy drinkers (n = 81) | Group 5 (Alcohol) Early-onset heavy drinkers (n = 65) |
| Negative urgency | -0.35 (0.91)a | -0.04 (1.04)b | 0.20 (1.00)b | 0.09 (0.95)a,b | 0.34 (0.97)b |
| Lack of premeditation | -0.41 (0.86)a | -0.08 (1.01)a,b | 0.34 (0.91)b,c | 0.27 (0.86)b,c | 0.41 (1.15)c |
| Lack of perseverance | -0.15 (0.99)a,b | 0.00 (1.04)a,b | 0.27 (0.89)b | 0.08 (0.94)a,b | -0.06 1.05)a |
| Sensation seeking | -0.42 (0.96)a | -0.13 (0.97)a | 0.25 (1.06)b | 0.43 (0.73)b | 0.45 .95)b |
| Delinquency | -0.43 (0.66)a | -0.13 (0.89)b | 0.23 (1.06)c | 0.31 (1.27)c,d | 0.63 (1.00)d |
| Violence | -0.17 (0.79)a | -0.25 (0.89)a | 0.18 (1.04)b | 0.16 (1.31)b | 0.63 (1.31)c |
| Marijuana | Group 1 (Marijuana) Abstainers (n = 215) | Group 2 (Marijuana) Occasional users (n = 160) | Group 3 (Marijuana) Moderate users (n = 126) | Group 4 (Marijuana) High users (n = 25) | |
| Negative urgency | -0.27 (0.95)a | 0.00 (0.96)a | 0.39 (0.98)b | 0.47 (1.03)b | |
| Lack of premeditation | -0.29 (0.89)a | -0.01 (0.94)a,b | 0.50 (1.05)c | 0.29 (1.05)a,b | |
| Lack of perseverance | -0.18 (0.97)a | 0.09 (1.03)b | 0.16(0.99)c | 0.14 (1.07)d | |
| Sensation seeking | -0.28 (0.96)a | 0.03 (0.96)b | 0.43 (0.93)c | 0.27 (1.04)b,c | |
| Delinquency | -0.44 (0.66)a | -0.07 (0.91)a | 0.62 (1.07)b | 1.07 (1.26)b | |
| Violence | -0.24 (0.79)a | -0.09 (0.90)a | 0.40 (1.22)b | 0.70 (1.11)b |
| Hard drugs | Group 1 (Hard drug) Nil to low users (n = 389) | Group 2 (Hard drug) Experimenters (n = 74) | Group 3 (Hard drug) Late-onset heavy users (n = 41) | Group 4 (Hard drug) Early-onset heavy users (n = 22) | |
| Negative urgency | -0.13 (0.97)a,b | 0.36 (1.06)c | 0.22 (0.88)b,c | 0.70 (0.88)c | |
| Lack of premeditation | -0.13 (0.95)a | 0.34 (1.00)a,b | 0.09(1.10)a | 0.95 (1.01)b | |
| Lack of perseverance | -0.08 (0.98)a | 0.20 (1.04)a | 0.18(1.07)a | 0.48 (0.89)a | |
| Sensation seeking | -0.13 (0.98)a | 0.33 (0.99)b | 0.26 (0.92)b | 0.72 (0.97)b | |
| Delinquency | -0.20 (0.86)a | 0.56 (1.10)b | 0.29 (1.06)b | 1.17 (1.20)c | |
| Violence | -0.10 (0.93)a | 0.29 (1.12)b,c | 0.06 (0.90)a,b | 0.77 (1.39)c |
Notes: Significance of differences between trajectory groups was derived from multinomial logistic regression models using IBM SPSS Statistics for Windows, Version 21.0. Trajectory group membership was regressed on individual difference variables (impulsive personality, delinquency, violence). To avoid multicollinearity, each class of independent variable was entered into different models. Variables that share a superscript letter are not significantly different from one another in the row (p > .05). Likewise, variables that do not share a superscript are significantly different from one another in the row. Means are centered; therefore, 0 = mean of that variable. Standard deviations are presented in parentheses after the means. Comparisons across subgroups are based on modal assignment of participants. Odds ratios for all comparisons are available from the authors.

