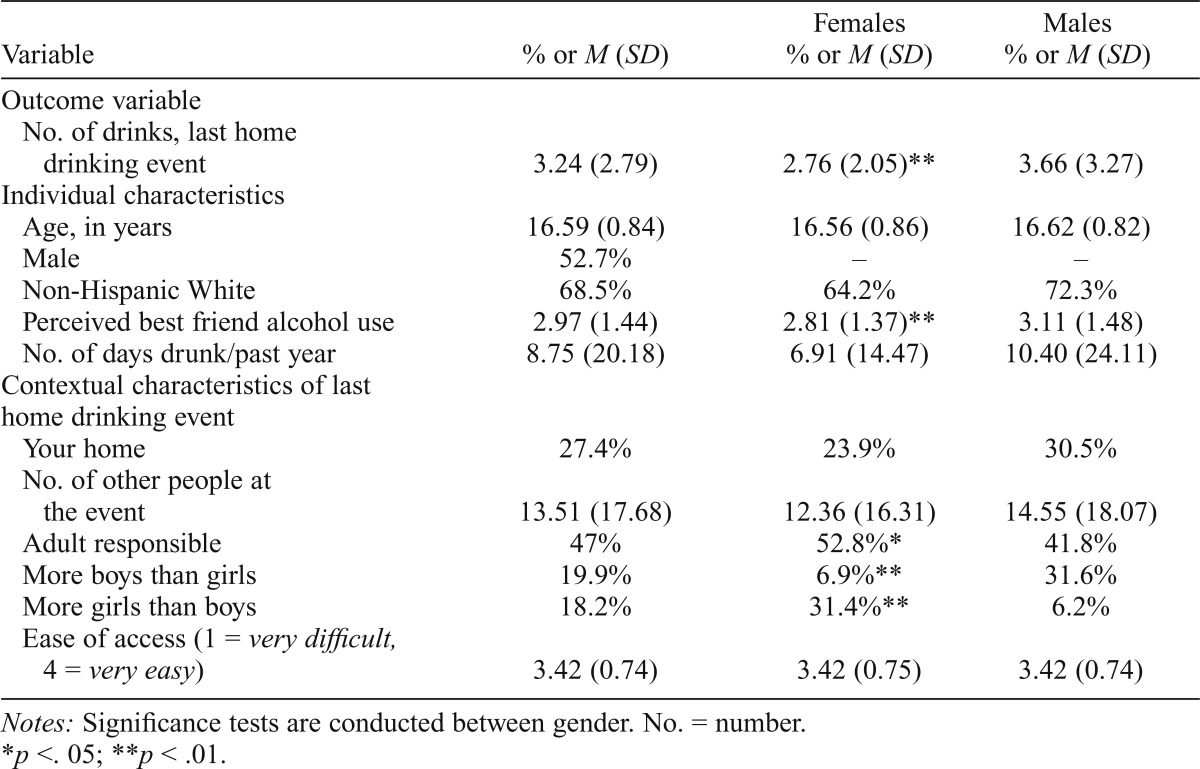
Table 1.
Individual and contextual characteristics among youth drinkers in the home: Gender differences
| Variable | % or M (SD) | Females % or M (SD) | Males % or M (SD) |
| Outcome variable | |||
| No. of drinks, last home | |||
| drinking event | 3.24 (2.79) | 2.76 (2.05)** | 3.66 (3.27) |
| Individual characteristics | |||
| Age, in years | 16.59 (0.84) | 16.56 (0.86) | 16.62 (0.82) |
| Male | 52.7% | – | – |
| Non-Hispanic White | 68.5% | 64.2% | 72.3% |
| Perceived best friend alcohol use | 2.97 (1.44) | 2.81 (1.37)** | 3.11 (1.48) |
| No. of days drunk/past year | 8.75 (20.18) | 6.91 (14.47) | 10.40 (24.11) |
| Contextual characteristics of last | |||
| home drinking event | |||
| Your home | 27.4% | 23.9% | 30.5% |
| No. of other people at | |||
| the event | 13.51 (17.68) | 12.36 (16.31) | 14.55 (18.07) |
| Adult responsible | 47% | 52.8%* | 41.8% |
| More boys than girls | 19.9% | 6.9%** | 31.6% |
| More girls than boys | 18.2% | 31.4%**q | 6.2% |
| Ease of access (1 = very difficult, 4 = very easy) | 3.42 (0.74) | 3.42 (0.75) | 3.42 (0.74) |
Notes: Significance tests are conducted between gender. No. = number.
p <. 05;
p <.01.

