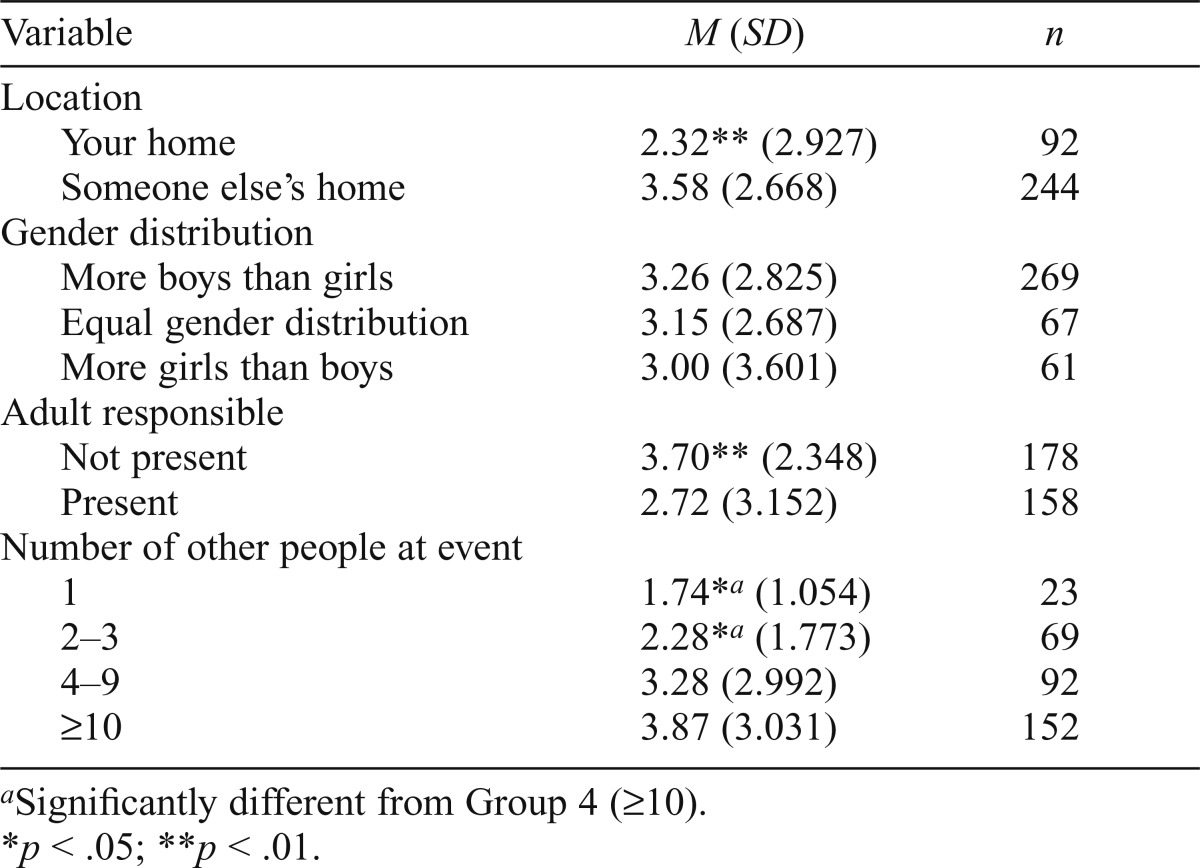
Table 3.
Total number of drinks at last home drinking event by situational characteristic
| Variable | M (SD) | n |
| Location | ||
| Your home | 2.32** (2.927) | 92 |
| Someone else’s home | 3.58 (2.668) | 244 |
| Gender distribution | ||
| More boys than girls | 3.26 (2.825) | 269 |
| Equal gender distribution | 3.15 (2.687) | 67 |
| More girls than boys | 3.00 (3.601) | 61 |
| Adult responsible | ||
| Not present | 3.70** (2.348) | 178 |
| Present | 2.72 (3.152) | 158 |
| Number of other people at event | ||
| 1 | 1.74*,a (1.054) | 23 |
| 2–3 | 2.28*,a (1.773) | 69 |
| 4–9 | 3.28 (2.992) | 92 |
| >10 | 3.87 (3.031) | 152 |
Significantly different from Group 4 (>10).
p < .05;
p < .01.

