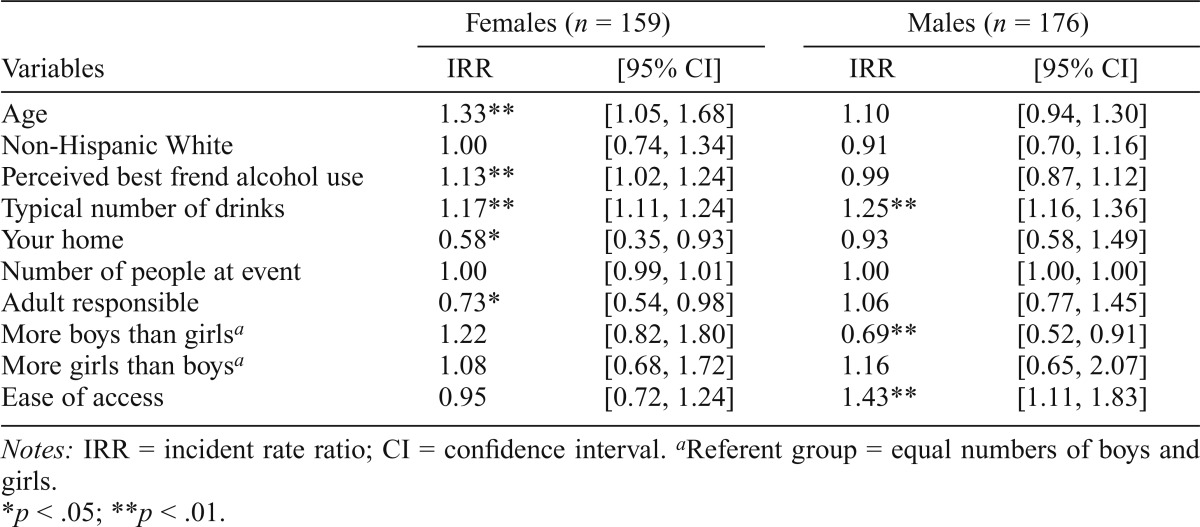
Table 5.
Gender differences
| Variables | Females (n = 159) |
Males (n = 176) |
||
| IRR | [95% CI] | IRR | [95% CI] | |
| Age | 1.33** | [1.05, 1.68] | 1.10 | [0.94, 1.30] |
| Non-Hispanic White | 1.00 | [0.74, 1.34] | 0.91 | [0.70, 1.16] |
| Perceived best frend alcohol use | 1.13** | [1.02, 1.24] | 0.99 | [0.87, 1.12] |
| Typical number of drinks | 1.17** | [1.11, 1.24] | 1.25** | [1.16, 1.36] |
| Your home | 0.58* | [0.35, 0.93] | 0.93 | [0.58, 1.49] |
| Number of people at event | 1.00 | [0.99, 1.01] | 1.00 | [1.00, 1.00] |
| Adult responsible | 0.73* | [0.54, 0.98] | 1.06 | [0.77, 1.45] |
| More boys than girlsa | 1.22 | [0.82, 1.80] | 0.69** | [0.52, 0.91] |
| More girls than boysa | 1.08 | [0.68, 1.72] | 1.16 | [0.65, 2.07] |
| Ease of access | 0.95 | [0.72, 1.24] | 1.43** | [1.11, 1.83] |
Notes: IRR = incident rate ratio; CI = confidence interval. aReferent group = equal numbers of boys and girls.
p <.05;
p <.01.

