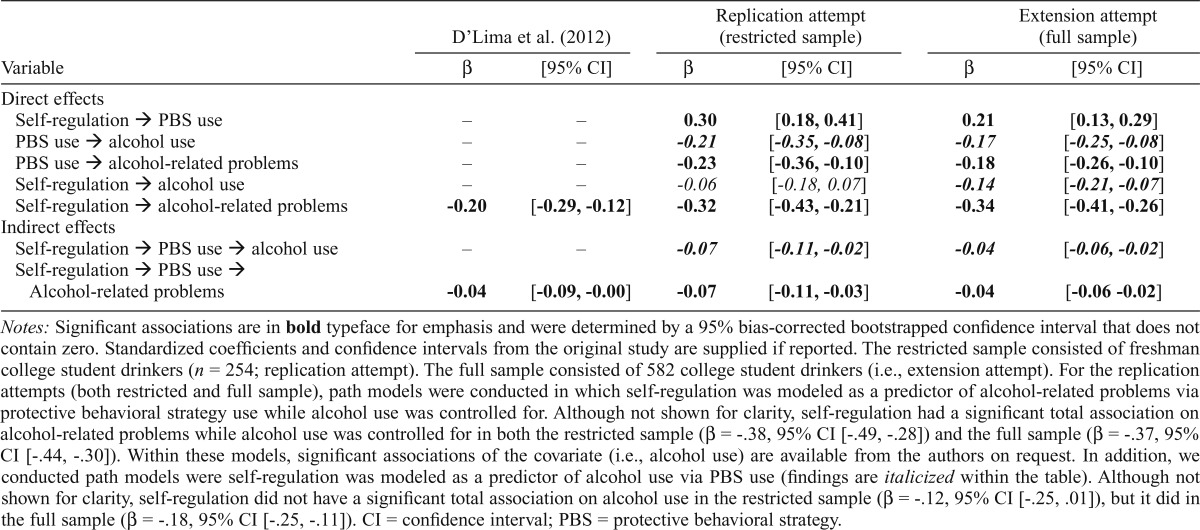
Table 3.
Replication Attempt 2: Total, direct, and indirect associations of self-regulation on alcohol use and alcohol-related problems comparing original
|
D’Lima et al. (2012) |
Replication attempt (restricted sample) |
Extension attempt (full sample) |
||||
| Variable | β | [95% CI] | β | [95% CI] | β | [95% CI] |
| Direct effects | ||||||
| Self-regulation → PBS use | – | – | 0.30 | [0.18, 0.41] | 0.21 | [0.13, 0.29] |
| PBS use → alcohol use | – | – | -0.21 | [-0.35, -0.08] | -0.17 | [-0.25, -0.08] |
| PBS use → alcohol-related problems | – | – | -0.23 | [-0.36, -0.10] | -0.18 | [-0.26, -0.10] |
| Self-regulation → alcohol use | – | – | -0.06 | [-0.18, 0.07] | -0.14 | [-0.21, -0.07] |
| Self-regulation → alcohol-related problems | -0.20 | [-0.29, -0.12] | -0.32 | [-0.43, -0.21] | -0.34 | [-0.41, -0.26] |
| Indirect effects | ||||||
| Self-regulation → PBS use → alcohol use | – | – | -0.07 | [-0.11, -0.02] | -0.04 | [-0.06, -0.02] |
| Self-regulation → PBS use → Alcohol-related problems | -0.04 | [-0.09, -0.00] | -0.07 | [-0.11, -0.03] | -0.04 | [-0.06 -0.02] |
Notes: Significant associations are in bold typeface for emphasis and were determined by a 95% bias-corrected bootstrapped confidence interval that does not contain zero. Standardized coefficients and confidence intervals from the original study are supplied if reported. The restricted sample consisted of freshman college student drinkers (n = 254; replication attempt). The full sample consisted of 582 college student drinkers (i.e., extension attempt). For the replication attempts (both restricted and full sample), path models were conducted in which self-regulation was modeled as a predictor of alcohol-related problems via protective behavioral strategy use while alcohol use was controlled for. Although not shown for clarity, self-regulation had a significant total association on alcohol-related problems while alcohol use was controlled for in both the restricted sample (β = -.38, 95% CI [-.49, -.28]) and the full sample (β = -.37, 95% CI [-.44, -.30]). Within these models, significant associations of the covariate (i.e., alcohol use) are available from the authors on request. In addition, we conducted path models were self-regulation was modeled as a predictor of alcohol use via PBS use (findings are italicized within the table). Although not shown for clarity, self-regulation did not have a significant total association on alcohol use in the restricted sample (β = -.12, 95% CI [-.25, .01]), but it did in the full sample (β = -.18, 95% CI [-.25, -.11]). CI = confidence interval; PBS = protective behavioral strategy.

