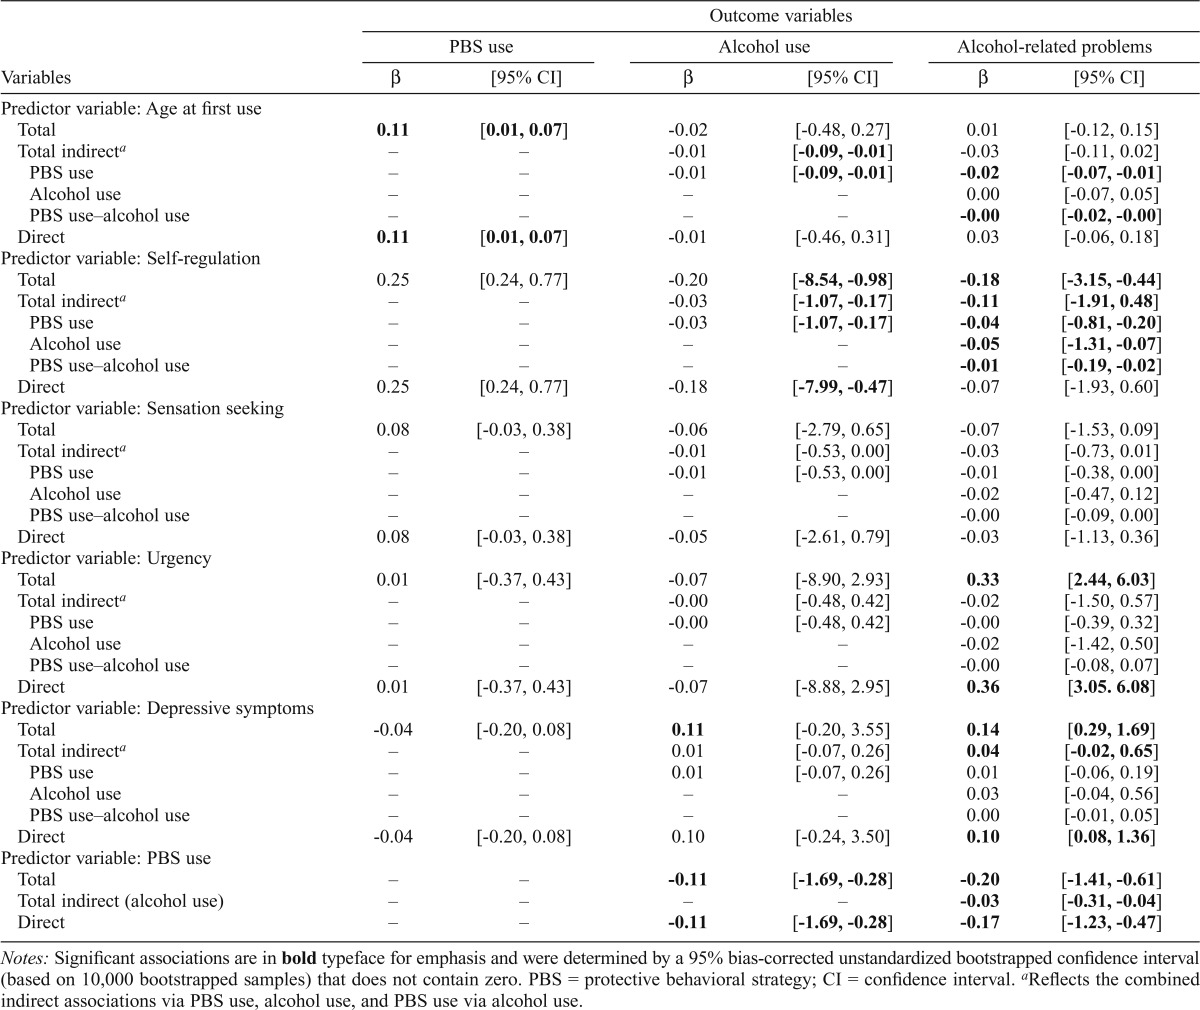
Table 5.
Summary of total, indirect, and direct associations of distal antecedents and PBS use on alcohol outcomes in a comprehensive model
| Outcome variables |
||||||
| PBS use |
Alcohol use |
Alcohol-related problems |
||||
| Variables | β | [95% CI] | β | [95% CI] | β | [95% CI] |
| Predictor variable: Age at first use | ||||||
| Total | 0.11 | [0.01, 0.07] | -0.02 | [-0.48, 0.27] | 0.01 | [-0.12, 0.15] |
| Total indirecta | – | – | -0.01 | [-0.09, -0.01] | -0.03 | [-0.11, 0.02] |
| PBS use | – | – | -0.01 | [-0.09, -0.01] | -0.02 | [-0.07, -0.01] |
| Alcohol use | – | – | – | – | 0.00 | [-0.07, 0.05] |
| PBS use–alcohol use | – | – | – | – | -0.00 | [-0.02, -0.00] |
| Direct | 0.11 | [0.01, 0.07] | -0.01 | [-0.46, 0.31] | 0.03 | [-0.06, 0.18] |
| Predictor variable: Self-regulation | ||||||
| Total | 0.25 | [0.24, 0.77] | -0.20 | [-8.54, -0.98] | -0.18 | [-3.15, -0.44] |
| Total indirecta | – | – | -0.03 | [-1.07, -0.17] | -0.11 | [-1.91, 0.48] |
| PBS use | – | – | -0.03 | [-1.07, -0.17] | -0.04 | [-0.81, -0.20] |
| Alcohol use | – | – | – | – | -0.05 | [-1.31, -0.07] |
| PBS use–alcohol use | – | – | – | – | -0.01 | [-0.19, -0.02] |
| Direct | 0.25 | [0.24, 0.77] | -0.18 | [-7.99, -0.47] | -0.07 | [-1.93, 0.60] |
| Predictor variable: Sensation seeking | ||||||
| Total | 0.08 | [-0.03, 0.38] | -0.06 | [-2.79, 0.65] | -0.07 | [-1.53, 0.09] |
| Total indirecta | – | – | -0.01 | [-0.53, 0.00] | -0.03 | [-0.73, 0.01] |
| PBS use | – | – | -0.01 | [-0.53, 0.00] | -0.01 | [-0.38, 0.00] |
| Alcohol use | – | – | – | – | -0.02 | [-0.47, 0.12] |
| PBS use–alcohol use | – | – | – | – | -0.00 | [-0.09, 0.00] |
| Direct | 0.08 | [-0.03, 0.38] | -0.05 | [-2.61, 0.79] | -0.03 | [-1.13, 0.36] |
| Predictor variable: Urgency | ||||||
| Total | 0.01 | [-0.37, 0.43] | -0.07 | [-8.90, 2.93] | 0.33 | [2.44, 6.03] |
| Total indirecta | – | – | -0.00 | [-0.48, 0.42] | -0.02 | [-1.50, 0.57] |
| PBS use | – | – | -0.00 | [-0.48, 0.42] | -0.00 | [-0.39, 0.32] |
| Alcohol use | – | – | – | – | -0.02 | [-1.42, 0.50] |
| PBS use-alcohol use | – | – | – | – | -0.00 | [-0.08, 0.07] |
| Direct | 0.01 | [-0.37, 0.43] | -0.07 | [-8.88, 2.95] | 0.36 | [3.05. 6.08] |
| Predictor variable: Depressive symptoms | ||||||
| Total | -0.04 | [-0.20, 0.08] | 0.11 | [-0.20, 3.55] | 0.14 | [0.29,1.69] |
| Total indirecta | – | – | 0.01 | [-0.07, 0.26] | 0.04 | [-0.02, 0.65] |
| PBS use | – | – | 0.01 | [-0.07, 0.26] | 0.01 | [-0.06, 0.19] |
| Alcohol use | – | – | - | – | 0.03 | [-0.04, 0.56] |
| PBS use–alcohol use | – | – | – | – | 0.00 | [-0.01, 0.05] |
| Direct | -0.04 | [-0.20, 0.08] | 0.10 | [-0.24, 3.50] | 0.10 | [0.08, 1.36] |
| Predictor variable: PBS use | ||||||
| Total | – | – | -0.11 | [-1.69, -0.28] | -0.20 | [-1.41, -0.61] |
| Total indirect (alcohol use) | – | – | – | – | -0.03 | [-0.31, -0.04] |
| Direct | – | – | -0.11 | [-1.69, -0.28] | -0.17 | [-1.23, -0.47] |
Notes: Significant associations are in bold typeface for emphasis and were determined by a 95% bias-corrected unstandardized bootstrapped confidence interval (based on 10,000 bootstrapped samples) that does not contain zero. PBS = protective behavioral strategy; CI = confidence interval.
Reflects the combined indirect associations via PBS use, alcohol use, and PBS use via alcohol use.

