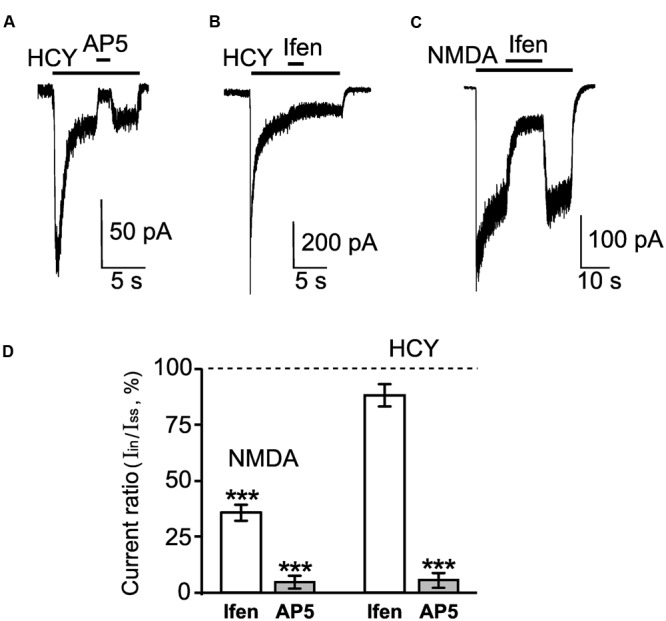
FIGURE 2.

Pharmacological properties of neuronal currents activated by HCY and NMDA. (A) Representative current trace recorded in a neuron at Vm = -55 mV activated by 50 μM HCY + 30 μM Gly. After current reached steady state, 100 μM AP-5 was applied. The application protocol is shown above the trace. (B) Representative current trace recorded in a neuron at Vm = -55 mV activated by 50 μM HCY + 30 μM Gly. After current reached steady state, 5 μM ifenprodil (ifen) was applied. The application protocol is shown above the trace. (C) Representative current trace recorded in a neuron at Vm = -55 mV activated by 30 μM NMDA + 30 μM Gly. After current reached steady state, 5 μM ifenprodil (ifen) was applied. The application protocol is shown above the trace. (D) Quantitative comparison of inhibition of NMDA-activated currents caused by 5 μM ifenprodil (ifen, n = 18) and 100 μM AP-5 (n = 24) and inhibition of HCY-activated currents caused by 5 μM ifenprodil (ifen, n = 26) and 100 μM AP-5 (n = 9). Ordinate axis – ratio of the current amplitude obtained during inhibition (Iin) to the steady-state current amplitude (Iss) obtained without antagonists. Data differ significantly from steady-state current control amplitudes (∗∗∗p < 0.0006, ANOVA, post hoc Bonferroni test).
