FIGURE 3.

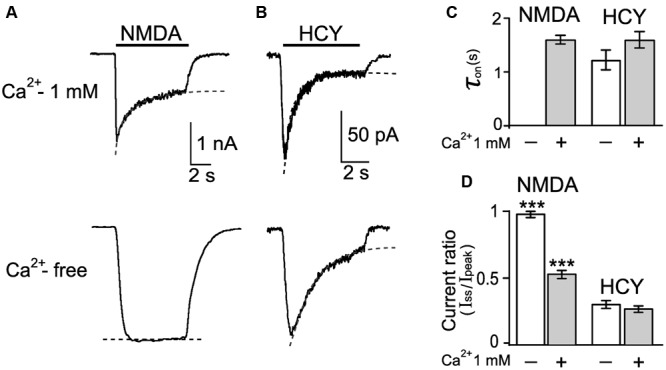
Desensitization of native NMDARs caused by NMDA and HCY. (A) Currents activated by 30 μM NMDA + 30 μM Gly in neurons recorded at Vm = -55 mV in the presence and absence of Ca2+ in the external bathing solutions. Dotted lines represent fits of a single exponential function to current decays. (B) Currents activated by 50 μM HCY + 30 μM Gly in neurons recorded at Vm = -55 mV in the presence and absence of Ca2+ in the external bathing solutions. Dotted lines represent fits of single exponential function to current decays. (C) Quantitative comparison of NMDAR desensitization onsets evoked by NMDA and HCY in the presence and absence of Ca2+ in the external bathing solution. τon was measured as the time constant of current decay to the steady-state level. Data do not differ (p > 0.36, ANOVA, n = 10). (D) Quantitative comparison of NMDAR desensitization evoked by NMDA and HCY in the presence and absence of Ca2+ in the external bathing solution. Ordinate axis – ratio of amplitudes obtained at steady-state (Iss) and peak (Ipeak) current as a measure of desensitization. Values differ significantly from data, obtained with HCY (∗∗∗p < 0.001, ANOVA, post hoc Bonferroni test, n varied from 16 to 56 for different data sets).
