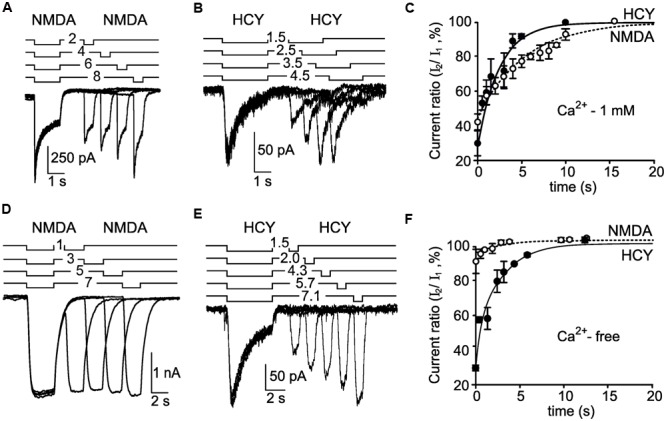
FIGURE 4.

Recovery from desensitization induced by NMDA and HCY. (A) An overlay of currents activated by 30 μM NMDA + 30 μM Gly using the paired application protocol (shown above the traces) recorded in the neuron at Vm = -55 mV in the presence of Ca2+ in the external bathing solution. (B) An overlay of currents activated by 50 μM HCY + 30 μM Gly using the paired application protocol (shown above the traces) recorded in the neuron at Vm = -55 mV in the presence of Ca2+ in the external bathing solution. (C) The dependence of the peak current amplitude achieved during the second agonist application on the duration of delay between applications. Ordinate axis – ratio of the peak amplitudes of the current elicited by the second application (I2) to the current elicited by the first application (I1). The peak amplitude of currents activated by the first application was taken for 100%. Open circles – the data obtained by NMDA applications (n = 6 for each point). Filled circles – the data obtained by HCY applications (n = 5 for each point). Lines represent fits of a single exponential function to the data points. (D) An overlay of currents activated by 30 μM NMDA + 30 μM Gly using the paired application protocol (shown above the traces) recorded in the neuron at Vm = -55 mV in Ca2+-free media. (E) An overlay of currents activated by 50 μM HCY + 30 μM Gly using the paired application protocol (shown above the traces) recorded in the neuron at Vm = -55 mV in Ca2+-free media. (F) The dependence of the peak current amplitude achieved during the second agonist application on the duration of delay between applications. Ordinate axis – ratio of the peak amplitudes of the current elicited by the second application (I2) to the current elicited by the first application (I1). The peak amplitude of currents activated by the first application was taken for 100%. Open circles – the data obtained by NMDA applications (n = 6 for each point). Filled circles – the data obtained by HCY applications (n = 4 for each point). Lines represent fits of a single exponential function to the data points.
