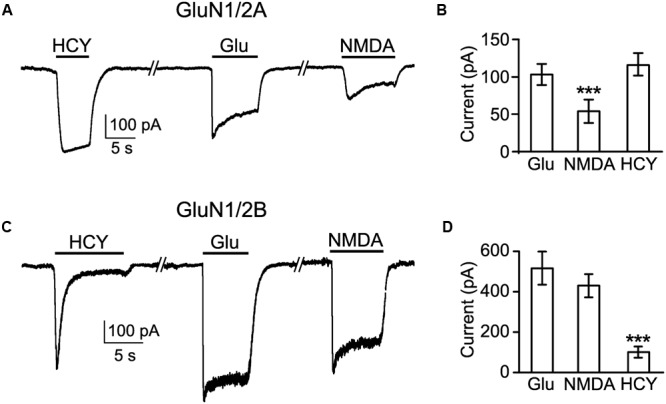
FIGURE 5.

Comparison of currents activated by HCY in HEK293T cells expressing recombinant GluN1/2A and GluN1/2B receptors. (A) Currents activated by 50 μM HCY, 100 μM Glu, and 30 μM NMDA in the presence of 30 μM Gly recorded in HEK293T cells at Vm = -35 mV expressing NMDARs of GluN1/2A subunit compositions. (B) Histogram of the steady-state amplitudes of currents activated by these agonists in the same cells. The data are significantly different (∗∗∗p < 0.0001, ANOVA, post hoc Bonferroni test, n = 37). (C) Currents activated by 50 μM HCY, 100 μM Glu, and 30 μM NMDA in the presence of 30 μM Gly recorded in HEK293T cells at Vm = -35 mV expressing NMDARs of GluN1/2B subunit compositions. (D) Histogram of the steady-state amplitudes of currents activated by these agonists in the same cells. The data are significantly different (∗∗∗p < 0.0001, ANOVA, post hoc Bonferroni test, n = 57).
