
FIGURE 6.
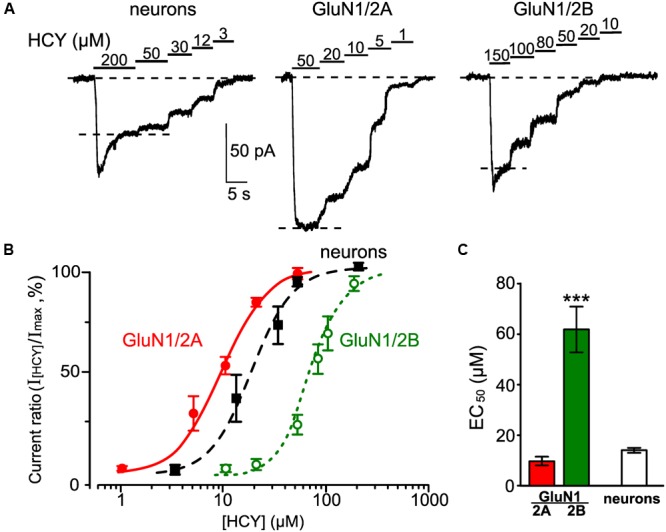
Measurements of EC50 for HCY as an agonist of native NMDARs and recombinant NMDARs of GluN1/2A and GluN1/2B subunit compositions. (A) Currents elicited by the indicated HCY concentrations in the presence of 30 μM Gly recorded in cortical neurons at Vm = -55 mV and in HEK293T cells expressing recombinant GluN1/2A and GluN1/2B NMDARs at Vm = -35 mV. Application protocols are indicated above the records. (B) Concentration-activation curves for HCY obtained for currents mediated by native NMDARs (filled squares) and recombinant NMDARs of GluN1/2A (filled circles) and GluN1/2B (open circles) subunit compositions. Ordinate axis – ratio of amplitudes obtained at steady state in the presence of different HCY concentrations (I[HCY]) to the maximal amplitude (Imax). Solid lines indicate fits of the data with the Hill equation. (C) Quantitative comparison of EC50s for HCY activation of native and recombinant GluN2A- and GluN2B-containing NMDARs. Data are significantly different (∗∗∗p < 0.0001, ANOVA, post hoc Bonferroni test, n = 6–10).