
FIGURE 4.
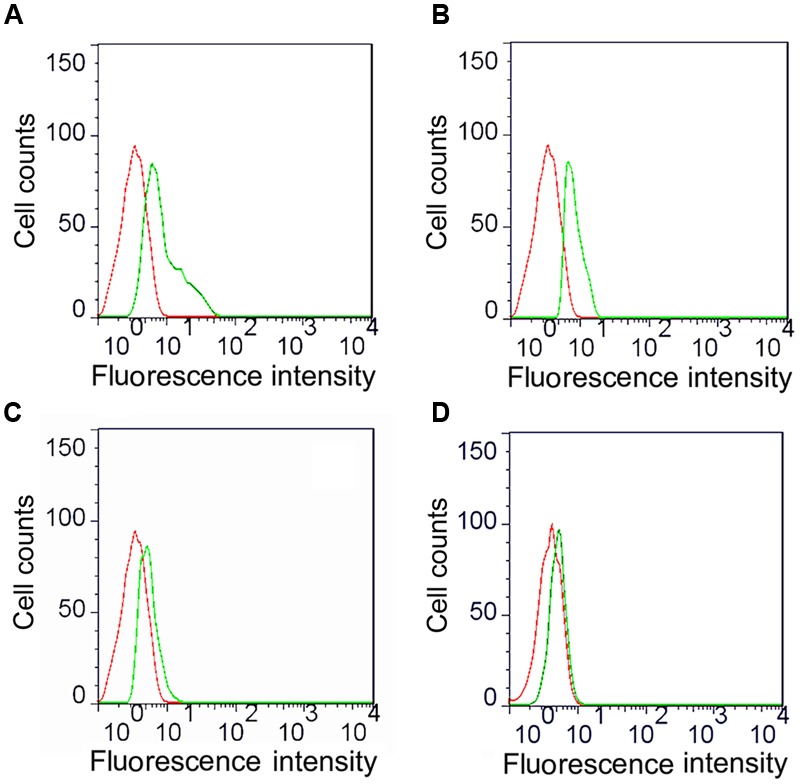
Flow cytometric analysis of MHC-II molecules expressed on macrophages. The macrophages were cultured into 24-well cell culture plates and 5 μg/mL ompA–Fc mixed with 50 μg/mL TPPPS (A), 5 μg/mL ompA–Fc (B), 5 μg/mL ompA (C), and 50 μg/mL TPPPS, (D) and 400 μL PBS were added into each well. After 6 h incubation, cells were incubated with 10 μL of mouse anti-chicken MHC-II antibody for 30 min and then stained with 1:500 FITC-conjugated goat anti-mouse antibody for 30 min. The expression of MHC-II molecules on the surface of macrophages was detected by flow cytometry. Red dotted line: PBS-treated macrophages (control group); green dotted line: recombinant protein and/or TPPPS-treated macrophages (experimental group). The images are representative of three independent experiments.