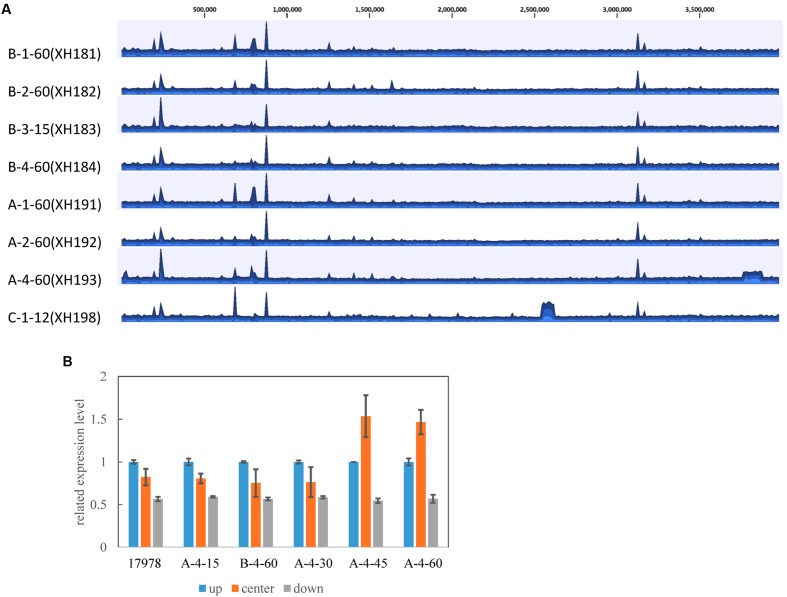
FIGURE 3.
(A) Coverage of colistin-resistant strains derived from A. baumannii ATCC 17978. Each plot shows the coverage for the alignment of each strain to the ATCC 17978 reference strain. The mean coverage for each strain is denoted by a curve (blue). Duplicated genomic segments appear as regions showing two or more mean coverages. (B) Confirmation of the 100 kb duplication in the colistin-resistant strains by RT-PCR. The genomic DNA was obtained from the strains and used as templates for RT-PCR. Three RT-PCR primers were designed upstream (up, A1S_3272), in the center (A1S_3302), and downstream (down, A1S_3366) of the duplication fragment. The error bars represent the SE from three replicates.

