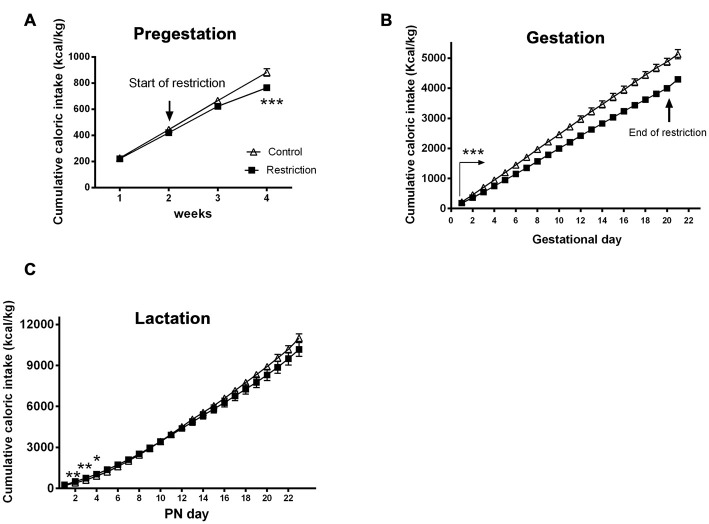
Figure 3.
Maternal caloric intake during pregestation, gestation and lactation period. Cumulative caloric intake (g) of control (open triangles) and restricted dams (solid squares) during pregestation (A) gestation (B) and lactation (C). Values are expressed as means ± SEM. *p < 0.05, **p < 0.01, ***p < 0.001. The arrow in (B) with statistical points ***denotes the interval of time with significant differences between groups (p < 0.001).

