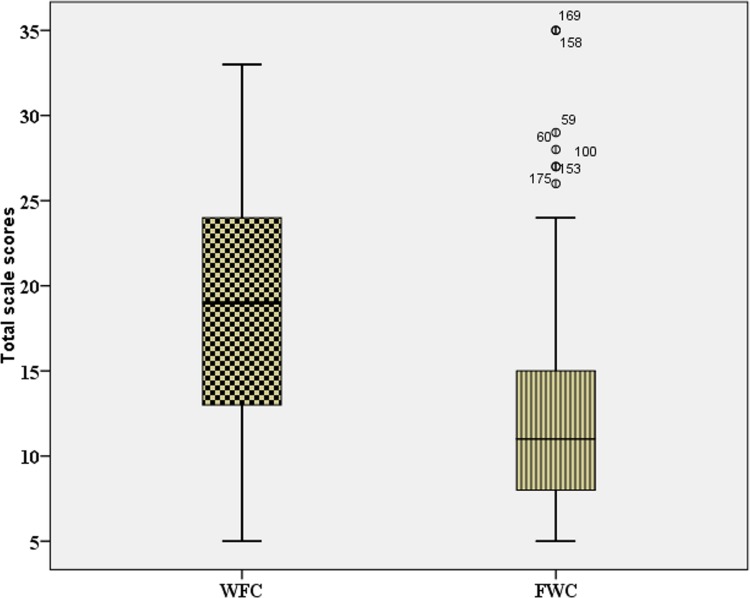
FIGURE 1.
The distribution of scores of work-family conflict (WFC) and family work conflict (FWC) for the group of Polish nurses (N = 188). The figure shows the minimum and maximum values, the medians (the dark lines inside the boxes), the lower quartiles (the bottom lines in the boxes), the upper quartiles (the top lines in the boxes), and extreme values (outliers) of the FWC.

