
Figure 2. Freshly isolated aortic SMCs and their phenotypic modulation .
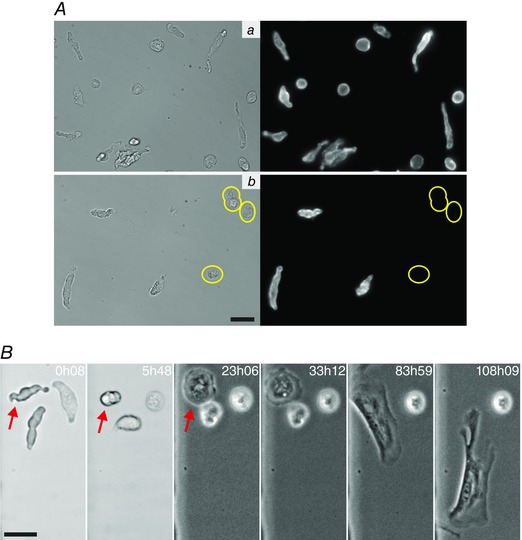
A, freshly isolated cells from the descending rat aorta stained for SMA. When the aortic tissue is fully stripped of adventitia and endothelium (Aa), all cells in the isolation stain for SM markers, even those with a more rounded morphology. In contrast, when the adventitia is not completely removed (Ab), non‐SM cells that do not stain for any SM markers are present (circled in yellow). B, a time sequence showing the change that a tracked aortic SMC (indicated by red arrow in initial frames) undergoes as it transforms in culture from its native, contractile state to a migratory phenotype. In this example the SMC became migratory from ∼65 h onwards. The times marked in the images (in hours and minutes) are the length of time in culture. All scale bars are 25 μm.