
Figure 7. Loss of response to the InsP3‐generating agonist PE as PV SMCs undergo phenotypic modulation .
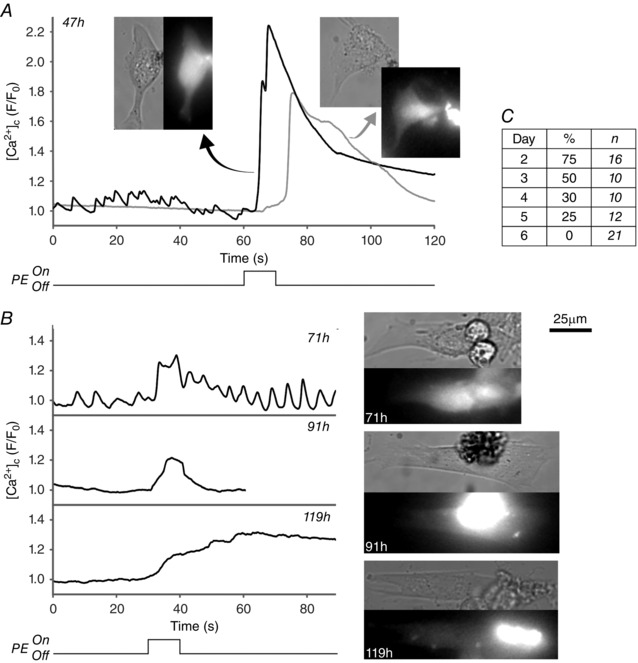
Changes in [Ca2+]c in response to PE puffing were measured by relative changes in Fluo‐4 fluorescence for PV SMCs that were maintained in culture conditions for 2–6 days. A, example traces showing a strong [Ca2+]c response to PE obtained from two PV SMCs after 47 h in culture (inset images are brightfield and Fluo‐4 fluorescence). Responses declined from day 3 onwards (B) along with a decrease in the overall percentage of cells responding to PE (C). Cells were counted as a ‘responder’ if an increase in F/F 0 of > 1.1 occurred. Fluorescence intensity values were measured from a circular region of interest within the cell body (with an expanded region of interest to account for cell contraction where necessary). The traces shown for 47 h and 119 h correspond to the cells in Movie 6 in Supporting information.