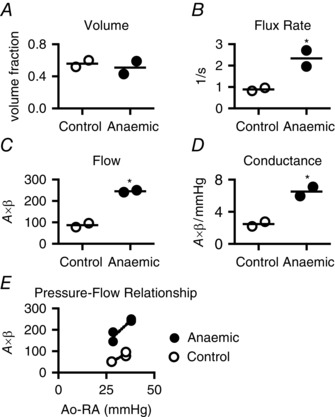
Figure 3. LV microvascular perfusion during hyperaemia and elevated perfusion pressure .

During occluder‐mediated elevation of perfusion pressure with simultaneous adenosine‐mediated coronary vasodilatation, LV microvascular volume (A) remained similar between control and anaemic fetuses. Both microvascular blood flux rate (B) and flow (C) in anaemic fetuses were more than twice that in control fetuses. Perfusion pressure was not different between groups, thus LV microvascular conductance (D) doubled in anaemic fetuses. E, demonstration of the relationship between pressure (aortic (Ao) minus right atrial (RA)) and microvascular hyperaemic flow in anaemic and control fetuses. Perfusion pressures were similar between groups at the two different points. *Different from control (P < 0.05). Mean and raw data shown (control, n = 2; anaemic, n = 2).
