
Figure 3. Effect of lung inflation on mean regional lung volume change (V/V0) .
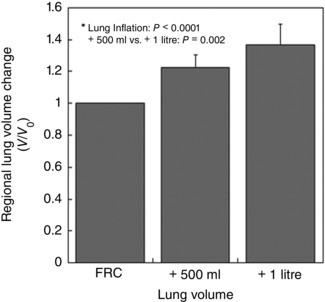
The continuous line at V/V 0 = 1 indicates there was no net inflation or deflation of regional lung volume. FRC + 500 ml and FRC + 1 litre showed approximately 22(9) and 37(13)% increases in the mean lung volume, respectively. Both measured regional lung volumes were significantly greater than FRC (= 1: continuous line) (P < 0.0001). The mean regional lung volume at FRC + 1 litre was also greater than that at FRC + 500 ml (P < 0.01). The error bars correspond to the standard deviation over seven subjects.