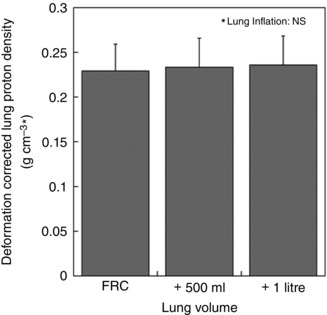
Figure 5. Deformation‐corrected density .

Density image at increased lung volume was corrected with the regional volume change map in order to capture the original lung density at FRC. The deformation‐corrected density is in units of g cm–3 * where * indicates that MR voxel size, which is the denominator in the units, is corrected by the local lung deformation. Deformation‐corrected density values at different lung volumes were nearly identical (P = 0.86). The error bars correspond to the standard deviation over seven subjects.
