
Figure 9. The relationship between regional volume change (V/V0) at +1 litre lung inflation and redistribution of pulmonary perfusion measured as the nDNP difference from FRC at a spatial scale of 10 × 10 voxels, 3.8 cm3 .
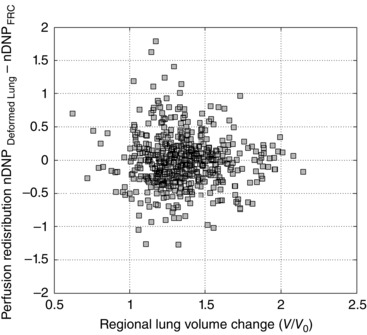
The 95th and 5th percentile cutoff was not applied to this data set. Data are from all seven subjects combined. The average slope of these relationships over the seven subjects was FRC + 1.0 litre: −0.06(0.32), which was not significantly different from zero (P = 0.73).