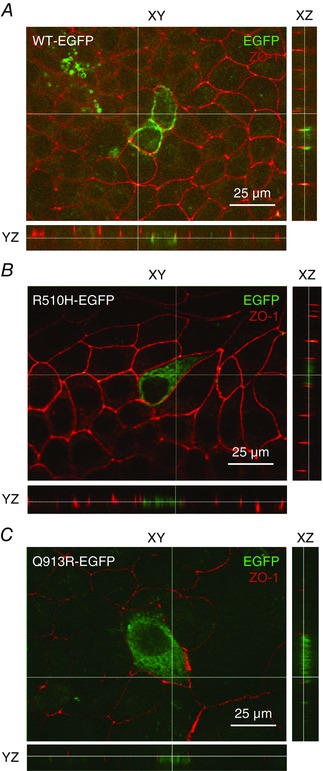
Figure 3. The distribution of NBCe1‐A‐EGFP vs. ZO‐1 in polarized MDCK‐II cells .

The location of NBCe1‐A‐EGFP is disclosed using an anti‐GFP primary antibody followed by an Alexa488‐conjugated secondary antibody. The distribution of the polarized‐cell tight‐junction marker ZO‐1 is disclosed using an Alexa594‐conjugated anti‐ZO‐1 antibody. A, cells transfected with WT‐EGFP exhibit lateral distribution of NBCe1‐A‐EGFP. B, cells transfected with R510H‐EGFP exhibit a cytoplasmic distribution of NBCe1‐A‐EGFP. C, cells transfected with Q913R‐EGFP also exhibit a cytoplasmic distribution of NBCe1‐A‐EGFP. Images in (A) to (C) are representative of the distribution of NBCe1‐A‐EGFP as observed in more than four cells in each of three independent transfections. The brightness of all images in (A) to (C) has been increased by 50% for clarity. The thin white lines in each indicate the location of the optical slices displayed in the other planes shown in each panel.
