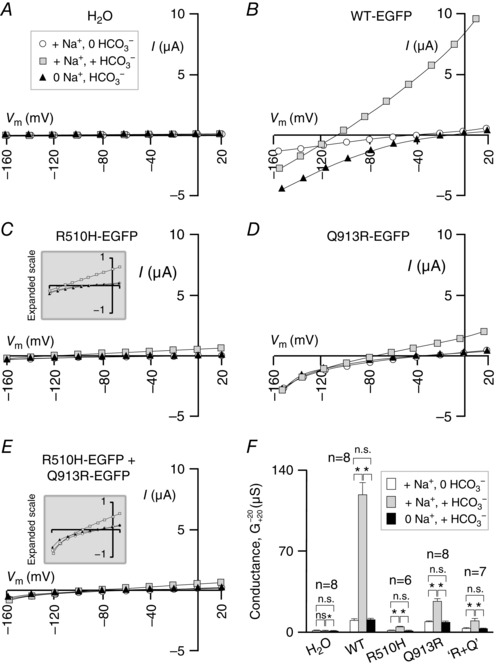
Figure 5. Na+‐dependence of wild‐type and mutant NBCe1‐A activity in oocytes .

A, current–voltage relationships from a representative H2O‐injected oocyte during sequential exposure to a ‘+Na/0HCO3 ’, a +’Na/+HCO3 ’ and a ‘0Na/+HCO3 ’ solution. Note that the data fell on top of each other and thus the sets have been offset from each other by 3 mV for clarity. Equivalent representative data are shown for oocytes expressing (B) WT‐EGFP, (C) R510H‐EGFP, (D) Q913R‐EGFP and (E) a mixture of R510H‐EGFP and Q913R‐EGFP. F, averaged membrane conductances for each group of cells in each solution, measured between −20 mV and +20 mV, where the outward currents elicited by electrogenic Na/HCO3 import in our protocol are the largest. * P < 0.01 in a paired one‐tailed t test between groups indicated by a horizontal bracket. n.s., no significant difference.
