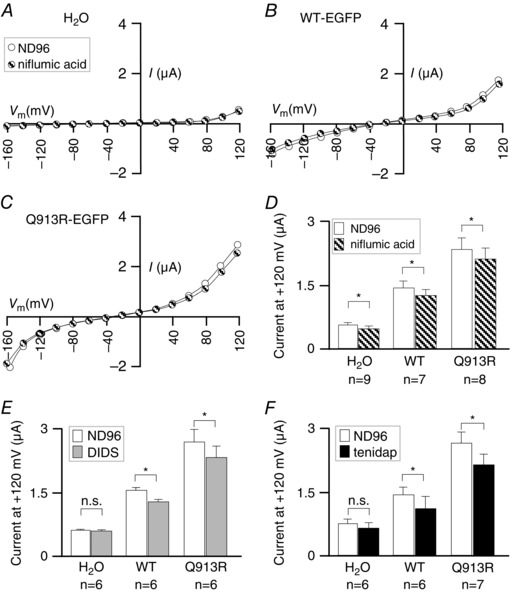
Figure 11. The influence of niflumic acid, DIDS and tenidap on Q913R‐EGFP in oocytes .

A, I–V relationships from a representative H2O‐injected oocyte during sequential exposure to ND96 followed by ND96 + 100 μm niflumic acid. Equivalent data are shown for oocytes expressing (B) WT‐EGFP or (C) Q913R‐EGFP. D, average currents at +120 mV gathered from a greater number of replicates such as those in (A) to (C). E, data similar to that shown in (D) for 200 μm DIDS. F, data similar to that shown in (D) for 100 μm tenidap. * P < 0.017 between the groups indicated using a paired, one‐tailed t test. Note that, in Fig. 9 D, the endogenous current in H2O‐injected cells at +120 mV was larger than that observed in experiments shown in (D), representing the batch dependence (among oocytes isolated from different batches of frogs) of endogenous currents.
