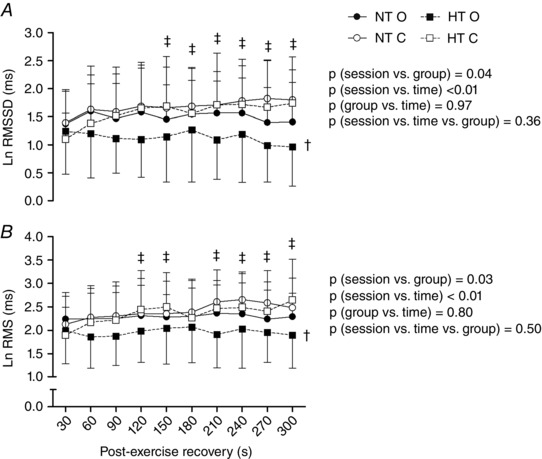
Figure 2. Post‐exercise heart rate variability indices .

Heart rate variability indices assessed in the first 300s of recovery after the control and the occlusion sessions in the normotensive (NT) and hypertensive (HT) groups. A, square root of the mean of the sum of the squares of differences between adjacent RR intervals in segments of 30s (RMSSD). B, root mean square of residuals of RR intervals in segments of 30s (RMS). NT O, NT group + occlusion session; NT C, NT group + control session; HT O, HT group + occlusion session; HT C, HT group + control session. † P ≤ 0.05 vs. NT. ‡ P ≤ 0.05 vs. control session.
