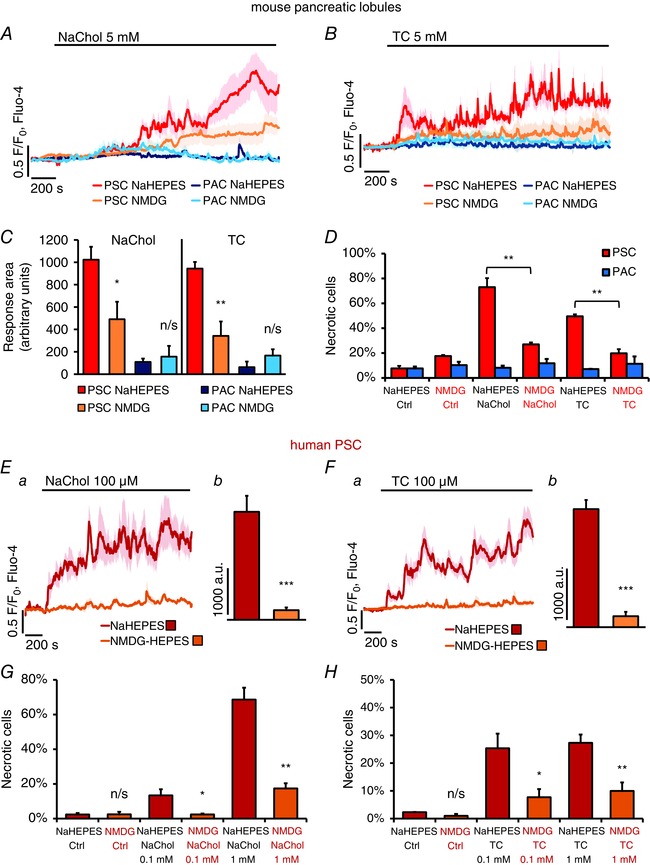
Figure 5. Dependence of Ca2+ responses and necrosis in pancreatic stellate cells (PSCs) on extracellular Na+ .

A, average traces (± SEM) showing Ca2+ responses to 5 mm sodium cholate in PSCs recorded in NaHepes (red, n = 8), PSCs in NMDG‐Hepes (yellow, n = 13), PACs in NaHepes (dark blue, n = 7) and PACs in NMDG‐Hepes (light blue, n = 13). B, average traces (± SEM) showing Ca2+ responses to 5 mm taurocholate in PSCs recorded in NaHepes buffer (red, n = 6), PSCs in NMDG‐Hepes (yellow, n = 8), PACs in NaHepes (dark blue, n = 18), PACs in NMDG‐Hepes (light blue, n = 14). C, the responses shown in A and B were quantitatively analysed by comparing the average Ca2+ increase above the baseline levels recorded between 200 and 2000 s (n numbers as in A and B). D, the bar chart compares necrosis in mouse PSCs (red bars) and PACs (blue bars) induced by 30 min incubation in the presence of 5 mm cholate or 5 mm taurocholate in NaHepes (bars also shown in Fig. 4 A) or in NMDG‐Hepes (N Ctrl = 4, N NaChol = 3, N TC = 3). Ea, average traces (± SEM) showing cytosolic Ca2+ responses to 100 μm cholate in hPSCs in NaHepes (red trace, n = 10) and in NMDG‐Hepes (orange trace, n = 11); Eb, average Ca2+ responses above the baseline levels (arbitrary units) calculated between 200 and 2000 s for the individual traces averaged in Ea. Fa, average traces (± SEM) showing cytosolic Ca2+ responses to 100 μm taurocholate in hPSCs in NaHepes (red trace, n = 37) and in NMDG‐Hepes (orange trace, n = 49); Fb, average Ca2+ responses above the baseline levels (arbitrary units) calculated between 200 and 2000 s for the individual traces averaged in Fa. G, the bar chart shows necrosis induced in hPSCs by 2 h incubation with 0.1 and 1 mm cholate, both in the presence (NaHepes) or absence of extracellular Na+ (NMDG‐Hepes); N = 4 for all. H, necrosis induced in hPSCs by 2 h incubation with 0.1 and 1 mm taurocholate, both in the presence (NaHepes) or absence of extracellular Na+ (NMDG‐Hepes); N = 4 for all.
