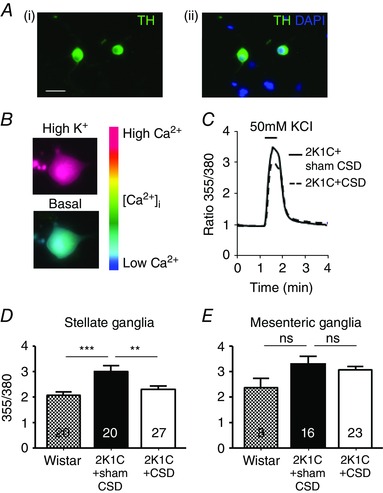
Figure 3. Intracellular free calcium transients in sympathetic neurons from the 2K1C+sham CSD rats, 2K1C+CSD rats and age‐matched controls (Wistar) .

A, (i) all neurons imaged were sympathetic as indicated by tyrosine hydroxylase immunopositivity (green) and (ii) were localized in relation to other nuclei stained in blue by 4′,6‐diamidino‐2‐phenylindole. B, pseudocolour‐coded ratio images of Fura‐2‐loaded neurons were obtained by conventional fluorescence microscopy. Ca2+ concentrations were colour‐coded with a basal Ca2+ concentration in blue and a high Ca2+ concentration in red. C, example recording from a stellate neuron exposed to 50 mmol l−1 of KCl (30 s) depolarization, resulting in a rise in intracellular free calcium concentration ([Ca2+]i). Note that CSD attenuated this response. D and E, quantitative data showing the difference in the peak evoked [Ca2+]i between Wistar and Goldblatt hypertensive rats with CSD (2K1C+CSD) or sham CSD (2K1C+sham CSD), obtained from stellate ganglia (D) and mesenteric ganglia (E) neurons collected and cultured from >3 rats per group. Numbers within bars refers to the number of neurons tested, with each response per neuron representing one K exposure. ** P < 0.01 and *** P < 0.001; one‐way ANOVA with Holm–Sidek post hoc comparisons test.
