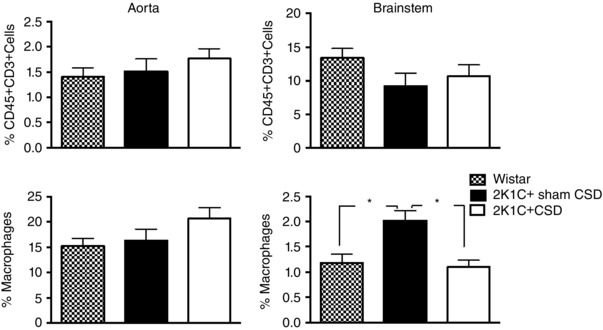
Figure 4. FACS data showing immune cell infiltration of vascular aortic and brainstem tissue in the 2K1C+sham CSD rats, 2K1C+CSD rats and age‐matched control Wistars .

CSD reduced macrophage infiltration in the brainstem but had no effect on CD45 and CD3 expressing T cells. One‐way ANOVA with Newman–Keuls multiple comparisons test. * P < 0.05. Data are presented as the mean ± SEM.
