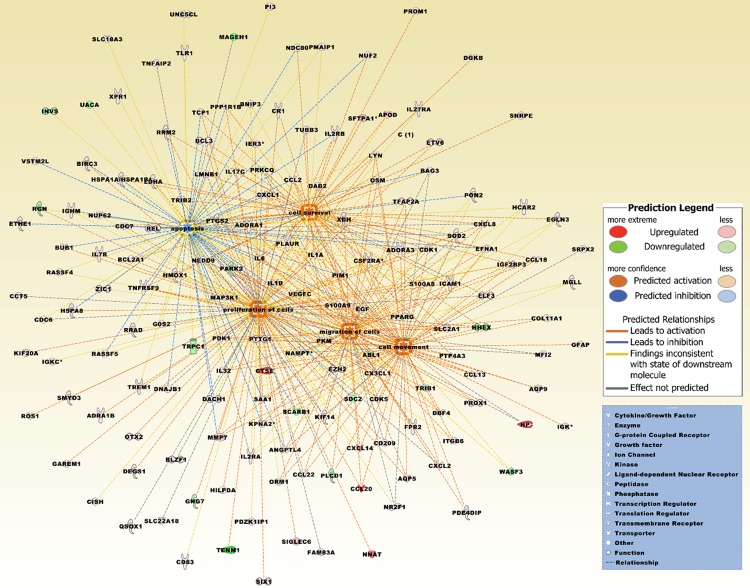
Figure 10.
The top five merged networks under the category diseases & functions were entitled migration of cells, cell movement, cell survival, apoptosis, and proliferation of cells. Increased activation is predicted by a z-score > 2 (Table 3). The network is based on the list of 429 differentially expressed probe sets that intersect between the four comparison groups (Figure 5B), and reflecting the expression values derived from the two comparison groups, brain metastatic PTC vs. non-brain metastatic PTCs and brain metastatic PTC (TR) vs. non-brain metastatic PTCs (Supplement Table 1). Upregulated molecules include ADORA1, ADORA3, ADRA1B, ANGPTL4, APOD, AQP5, AQP9, BAG3, BCL2A1, BCL3, BIRC3, BLZF1, BNIP3, BUB1, CCL13, CCL18, CCL2, CCL20, CCL22, CCT5, CD209, CD83, CDC6, CDC7, CDK1, CDK5, CISH, COL11A1, CR1, CSF2RA, CTSE, CX3CL1, CXCL1, CXCL14, CXCL2, CXCL8, DAB2, DACH1, DBF4, DEGS1, DGKB, DNAJB1, EFNA1, EGF, EGLN3, ELF3, ETHE1, ETV6, EZH2, FAM83A, FPR2, G0S2, GAREM1, GFAP, HCAR2, HILPDA, HMOX1, HP, HSPA1A/HSPA1B, HSPA8, ICAM1, IER3, IGF2BP3, IGHM, IGK, IGKC, IL17C, IL1A, IL1B, IL27RA, IL2RA, IL2RB, IL32, IL6, IL7R, ITGB6, KIF14, KIF20A, KPNA2, LDHA, LMNB1, LYN, MAP3K1, MFI2, MGLL, MMP7, NAMPT, NDC80, NEDD9, NNAT, NR2F1, NUF2, NUP62, ORM1, OSM, OTX2, PDE4DIP, PDK1, PDZK1IP1, PI3, PIM1, PKM, PLAUR, PMAIP1, PON2, PPARG, PPP1R1B, PROM1, PROX1, PTGS2, PTP4A3, PTTG1, QSOX1, RASSF4, RASSF5, REL, ROS1, RRAD, RRM2, S100A8, S100A9, SAA1, SFTPA1, SIGLEC6, SIX1, SLC18A3, SLC22A18, SLC2A1, SMYD3, SNRPE, SOD2, SRPX2, TCP1, TFAP2A, TLR1, TNFAIP2, TNFRSF9, TREM1, TRIB2, TUBB3, UNC5CL, VSTM2L, XDH, XPR1, and ZIC1. Downregulated molecules include ABL1, GNG7, HHEX, INVS, MAGEH1, PARK2, PLCD1, PRKCQ, RGN, SCARB1, SDC2, TENM1, TRIB1, TRPC1, UACA, VEGFC, and WASF3. The pathway was overlaid with the Molecule Activity Predictor to precalculate further molecular effects, as outlined in the prediction legend.

