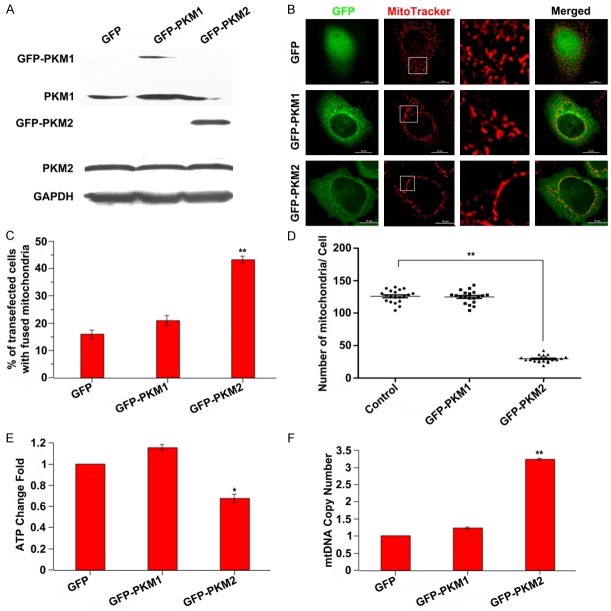
Figure 1.
PKM2 overexpression induces mitochondrial fusion and mitochondrial dysfunction. A: MCF-7 cells were transfected with GFP, GFP-PKM1 or GFP-PKM2 expressed construct for 24 h, the expression levels of PKM1 and PKM2 were assessed by western blot. B: Representative images of mitochondrial morphology. MCF-7 cells were transfected with GFP, GFP-PKM1 or GFP-PKM2 expressed construct for 24 h, then the mitochondrial was stained with Mitotracker dye and the morphology was observed by confocal fluorescent microscope. The insets are amplified images of the mitochondria morphology. Scale bar = 10 µm. C: The statistical analysis of transfected cells with fused mitochondria. **P < 0.01. D: Quantitative analysis of mitochondrial number. **P < 0.01. E: ATP production is decreased in PKM2 overexpressed cells. Intracellular ATP was determined using a luciferase-based luminescence assay kit according to the manufacturer’s instructions. *P < 0.05. F: PKM2 overexpression exhibited increased mitochondrial DNA copy number. Total DNA was extracted and relative levels of mtDNA copy number (ND1) were determined by qPCR. The nuclear gene HGB was used for normalization. **P < 0.01.

