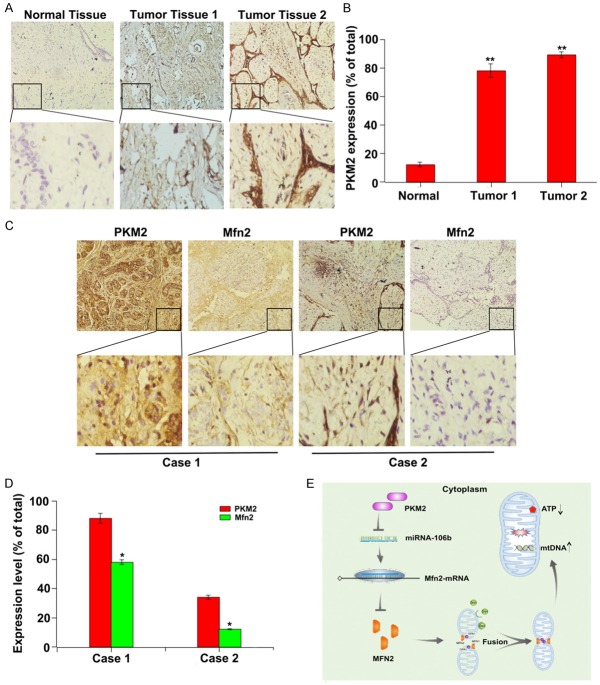
Figure 6.
Expression of PKM2 is positively correlated with Mfn2 expression in clinical samples. A: PKM2 expression was determined by IHC. Representative images of strong/weak staining in clinical samples of breast cancer and negative staining in the nontumorous samples were showed. B: The statistical analysis of PKM2 expression. **P < 0.01. C: The relationship of PKM2 and Mfn2 in clinical samples was determined by IHC. Representative immunohistochemical images of PKM2 and Mfn2 were showed. D: The statistical analysis of the correlation between PKM2 and Mfn2. **P < 0.01. E: The schematic of PKM2 regulating mitochondria dysfunction. PKM2 overexpression suppressed the expression of miR-106b, subsequently increased the expression of its target of Mfn2, eventually resulting in decreased ATP level and increased mtDNA copy number.

