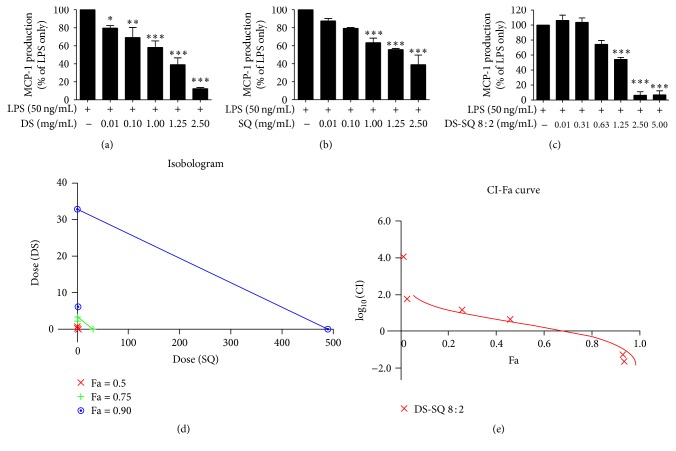
Figure 3.
Dose-response curves of MCP-1 production (%) versus concentration (mg/mL) for DS, SQ, and DS-SQ 8 : 2 on ELISA assays as shown in (a), (b), and (c). (d) Isobologram curves for DS, SQ, and DS-SQ 8 : 2 on MCP-1 ELISA assay. (e) CI values versus DS-SQ 8 : 2 MCP-1 inhibition effect (Fa). Solid line represents CI values at different Fa. Fa values correspond to % suppression. ∗ p < 0.05, ∗∗ p < 0.01, and ∗∗∗ p < 0.001 as compared to LPS stimulation only by one-way ANOVA.

