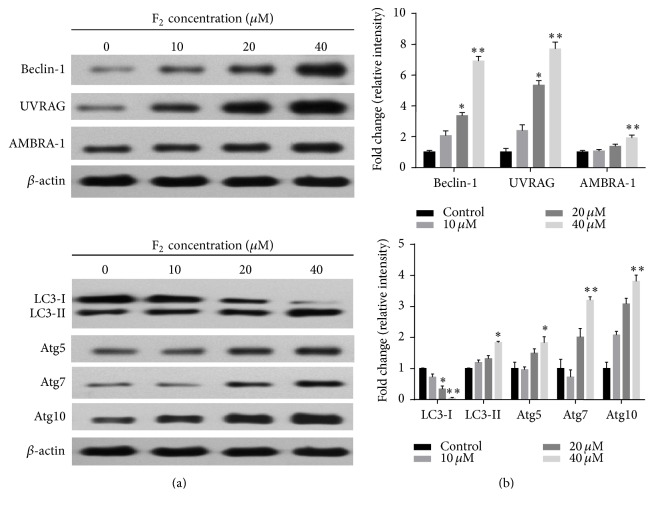
Figure 7.
Effect of ginsenoside F2 on the expression of Beclin-1, UVRAG, AMBRA-1, Atg5, Atg7, Atg10, LC3 I, and LC3-II. 1 × 10⁶ SGC7901 cells are seeded in 6-well plate for overnight. On day 2, the cultured cells are treated with different concentration ginsenoside F2. 12 hours after treatment, the protein is prepared by lysating cells with RIPA buffer for performing western blot analysis. Left panel: the representative western blot analysis. β-actin was used as the loading control. Right panel: accumulated results show the relative protein density. Error bars represent means ± SEMs. Significant difference is expressed as ∗∗ p < 0.01, ∗ p < 0.05.

