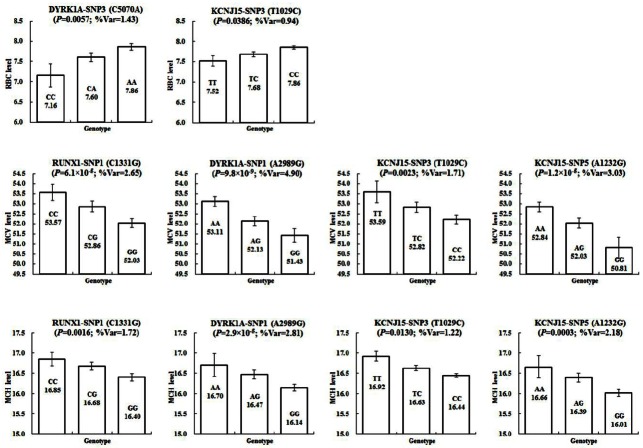
Figure 1.
The bar graph represents the genotypic mean and error of (A) red blood cell (RBC), (B) mean corpuscular volume (MCV), and (C) mean corpuscular hemoglobin (MCH) levels in the F2 generation of an intercross between Landrace and Korean native pigs. Significant associations (i.e., p value) between the genotype of single-nucleotide polymorphism (SNP) and traits, and additive genetic variances (% Var) explained by the SNP are given.

