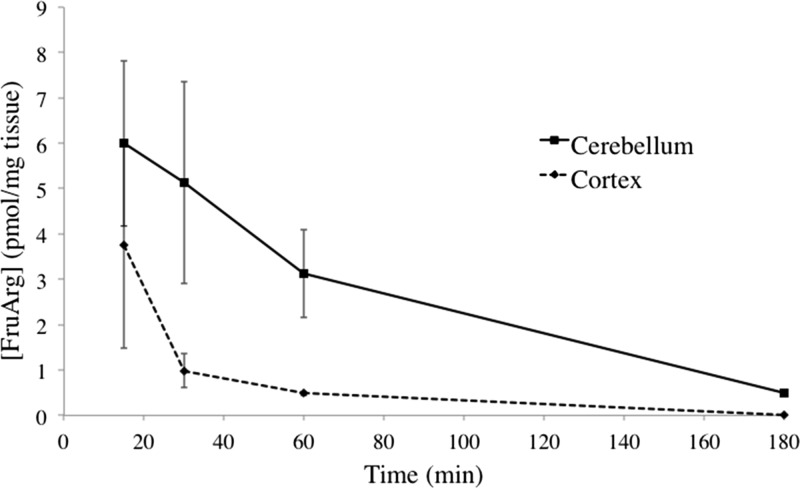
Figure 3.
Brain tissue concentration time curve of FruArg in the cerebellum and cortex. Concentration of FruArg in the cerebellum (solid line) and cortex (dotted line) brain subregions as a function of time at 15, 30, 60, and 180 min. Individual data points are represented as the average (n = 3) FruArg concentration (pmol/mg tissue) ± SE.

