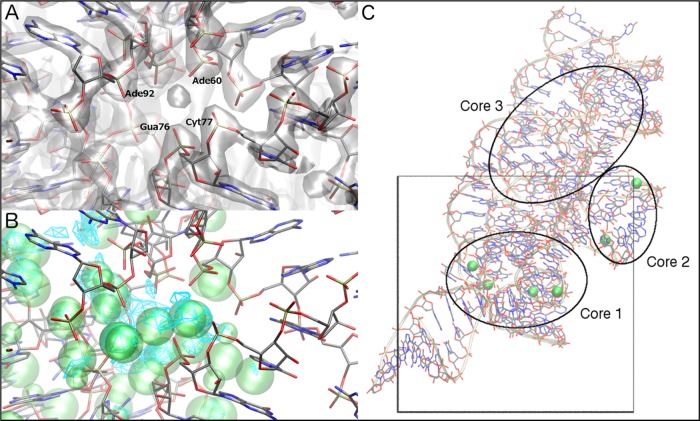
Figure 3.
Predicted Mg2+ binding site at the P4–P5 interface of the Mg2+ riboswitch. (A) Crystallographic electron density at the interface (gray surface) with residues ligating the crystallographic assigned water molecule labeled. (B) GFE maps (cyan mesh) and predicted Mg2+ binding sites (green spheres) at this site. (C) Three “core” Mg2+ binding regions of the M-box Mg2+ riboswitch according to Wakeman et al.29 are indicated. The GCMC sampling box is mapped onto the structure.

