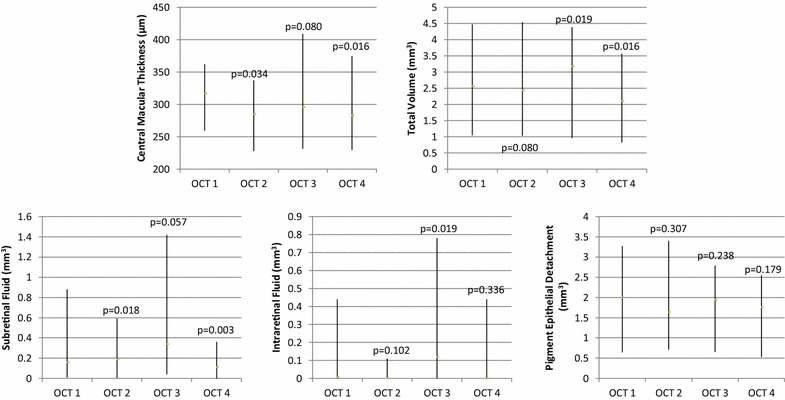
Fig. 1.

Optical coherence tomography (OCT) changes over the course of medication changes. Median values and interquartile ranges of central macular thickness, total fluid volume, subretinal fluid, intraretinal fluid, and pigment epithelial detachments over the course of anti-VEGF medication changes from OCT 1 (while patients were on bevacizumab or ranibizumab prior to aflibercept treatment) to OCT 2 (shortly after transitioning to aflibercept treatment), then OCT 3 (while patients were on aflibercept treatment prior to transition back to bevacizumab or ranibizumab), and finally OCT 4 (shortly after patients were re-started on bevacizumab or ranibizumab)
