
Fig. 5.
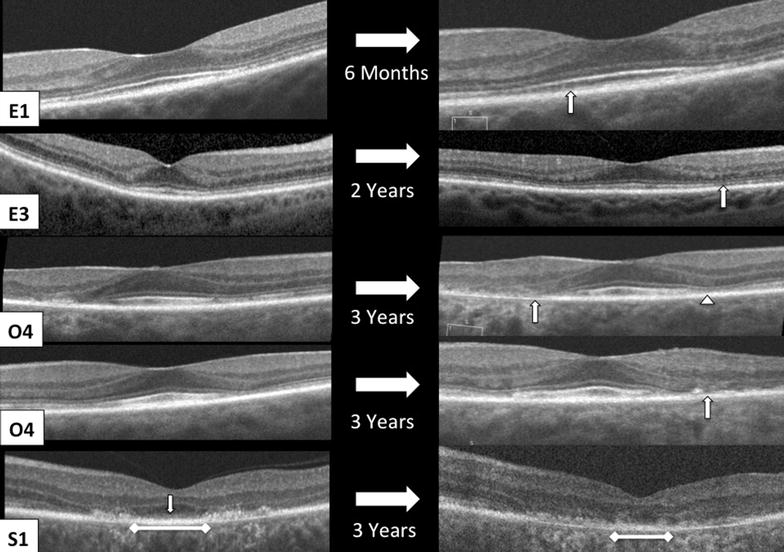
Examples of changes in SD-OCT appearance from the time of diagnosis of HCQ retinopathy (left column) to after drug cessation (right column). E1, left eye, shows progressive interdigitation zone disruption (arrow). E4, right eye, shows development of parafoveal EZ disruption (arrow). O4, right eye, shows progressive RPE atrophy of the temporal parafovea (arrow) and progressive EZ disruption of the nasal parafovea (arrowhead). O4, left eye, shows progressive disruption of the ELM, EZ, and RPE in the temporal parafovea (arrow). S1, left eye, shows progressive loss of the foveal ELM (arrow), foveal RPE migration into outer retina, and disruption with shortening of foveal RPE (ruler)