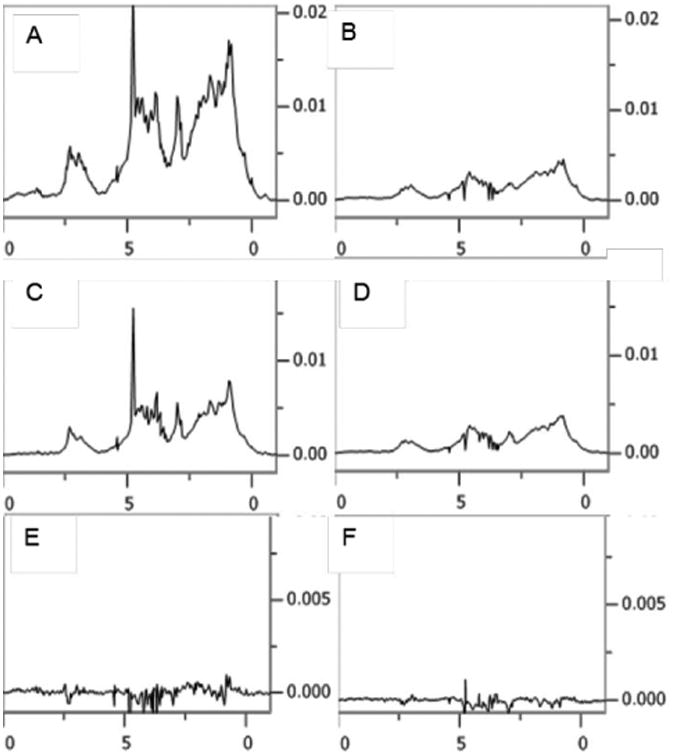
Figure 5.

Comparison of spectral components of mAbB and mAbT. Sharper spectral components are in (A) and (C) respectively. Broader spectral components of mAbB and mAbT are in (B) and (D) respectively. The scaled differences between mAbT and mAbB in sharper (A-C) and broader components (B-D) are shown in (E) and (F) respectively (note the factor of 2 increase in vertical intensity scale for E and F). Horizontal axes are in ppm.
