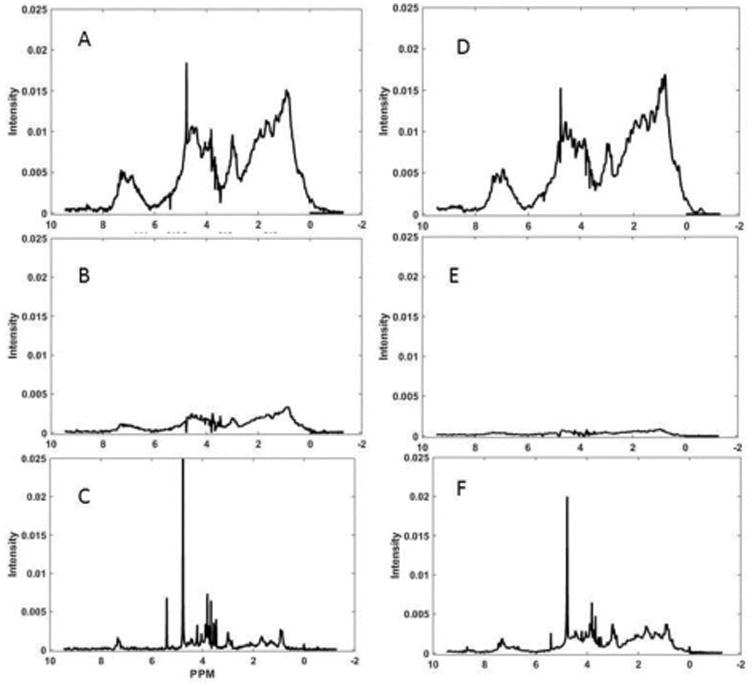
Figure 6.

Comparison of spectral components of mAbB at pH 6.5 and pH 4.5. Sharper HOS components at pH 6.5 and 4.5 are shown in A and D respectively. Broader HOS components at pH 6.5 and 4.5 are shown in B and E respectively. Comparison of less ordered components pH 6.5 and pH 4.5) are shown in C and F respectively.
