Fig. 2.

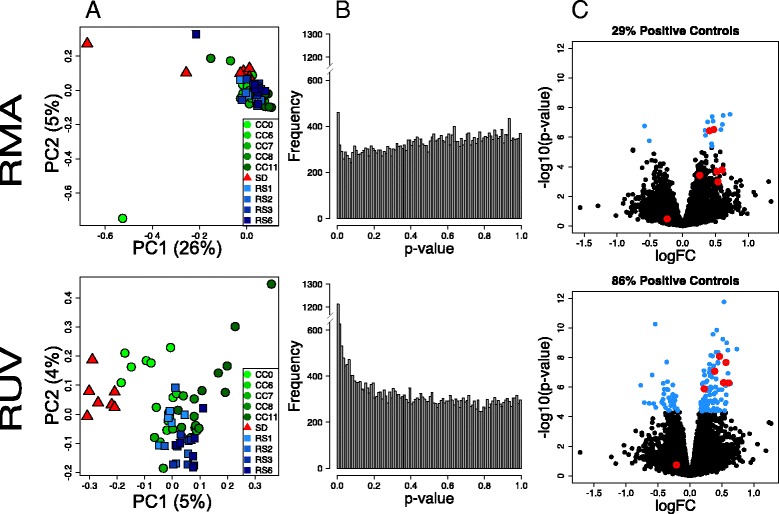
Analysis of the effect of sleep deprivation and subsequent recovery sleep in the murine cortex. a Scatterplots of first two principal components (log-scaled, centered counts) following RMA and RUV normalization. Percent variance explained by each PC in parenthesis. Triangles denote samples collected following sleep deprivation (SD), circles control samples matched by time of day (CC, number indicates ZT time) and squares samples collected after recovery sleep (RS). Samples only cluster according to treatment after RUV normalization. b Distribution of unadjusted p-values for tests of differential expression between one hour of recovery sleep (RS1) and control samples following RMA and RUV normalization. RUV increases discovery of differentially expressed genes (genes that have a low p-value). c Volcano plot of differential expression (−log10 p-value vs log fold change) of RMA and RUV normalized samples. Genes with an FDR <0.01 are highlighted in blue. Positive controls are circled in red; RUV increases the detection of known differentially expressed genes following recovery sleep. PCA plots were performed using the R/Bioconductor package EDASeq (v. 2.0.0). RUVs normalization was performed using the R/Bioconductor package RUVSeq (v. 1.0.0). Differential expression analysis was performed using R/Bioconductor package limma. The analysis was based only on samples were collected from current laboratory
