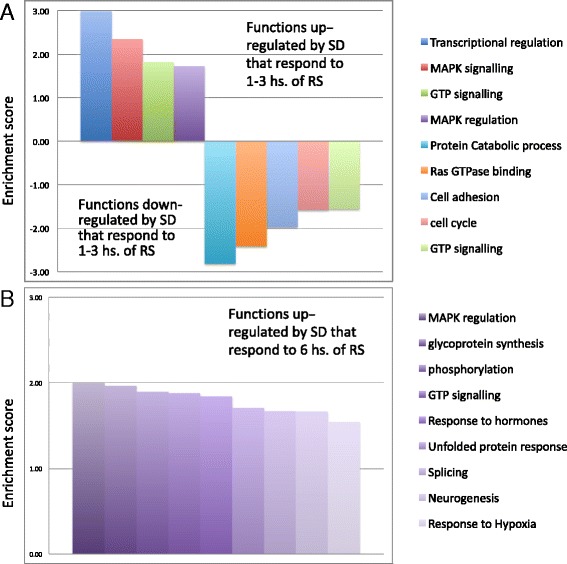
Fig. 5.

Enriched functional clusters regulated by recovery sleep. a Functional clusters regulated by 1–3 h of recovery sleep. b Functional clusters regulated by 6 h of recovery sleep. Functional annotation terms from the following databases: Gene Ontology (GO) biological process and molecular function, KEGG pathways and protein information resource keywords, were clustered based on similarity using the Database for Annotation Visualization and Integrated Discovery (see Methods). Clusters of functional terms enriched in down- or upregulated gene lists following SD as compared with the genome as a whole (P value <0.05) are represented as bars. Height of bars represents the enrichment score of each cluster, with the scores of downregulated clusters shown as negative numbers for visualization purposes. Enrichment score was calculated as − log(10) of the geometric mean p-value among all clustered terms. Only clusters with enrichment score >1.5 (average p-value of functional terms within the cluster <0.05) were considered. For details of the functional terms included in these clusters, as well as enriched functional terms that did not cluster with other terms, see Additional file 7
