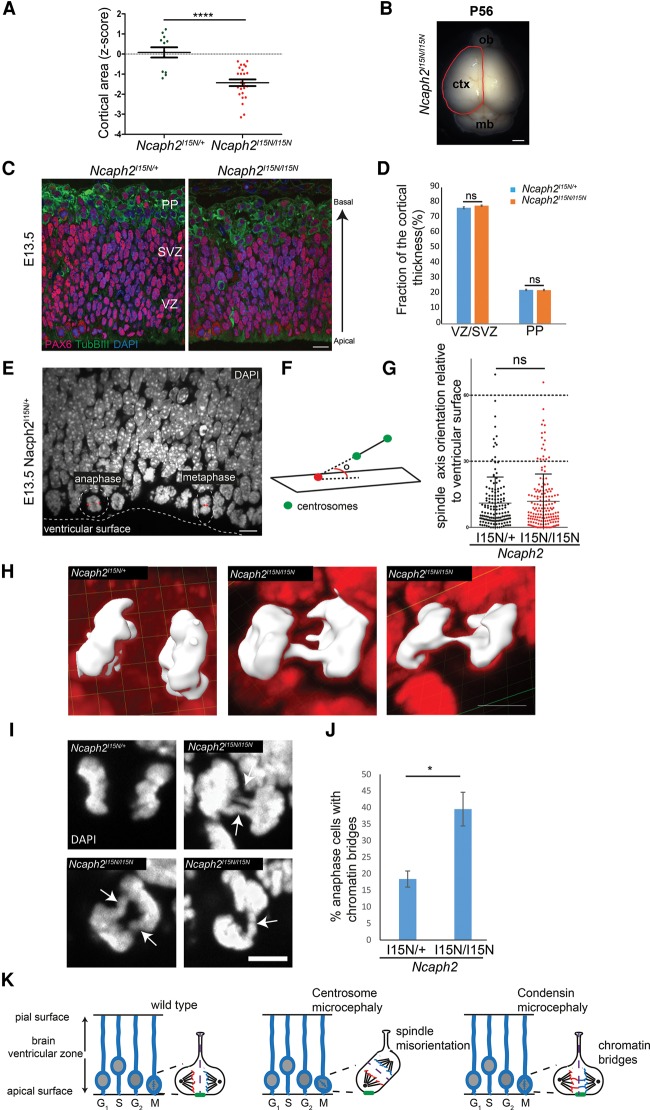
Figure 3.
Impaired chromosome segregation instead of altered neural progenitor cleavage plane accounts for reduced cortical size in Ncaph2I15N/I15N mice. (A,B) Cerebral cortex surface area is reduced in Ncaph2I15N/I15N mice at 8 wk. (A) Quantification of cortical area expressed as a Z-score at 8 wk of age. n > 12 mice per genotype. Error bars indicate SEM. Two-tailed t-test, (****) P ≤ 0.0001 versus littermate Ncaph2I15N/+ mice. (B) Cortical area measurement. The red line indicates the measured region of the dorsal cerebral cortex. Bar, 1.5 mm. Z-score is defined as the standard deviations from the mean of age- and sex-matched Ncaph2I15N/+ mice at 8 wk. (C,D) The relative proportion of progenitor cells and neurons is retained during neurogenesis in Ncaph2I15N/I15N mice. (C) Representative images of neurogenesis in E13.5 Ncaph2I15N/+ and Ncaph2I15N/I15N coronal sections immunostained for PAX6 (radial glia; red), TUBβIII (neurons; green), and DAPI (DNA; blue). (D) Quantification of proportions of TUBβIII- and PAX6-positive cells per radial unit, determined by measurement of the thickness of the PP and SVZ/VZ, respectively. Measurements made at four regions per coronal section for two coronal sections at equivalent rostro–caudal positions per brain. n = 10 brains analyzed for Ncaph2I15N/+; n = 9 brains analyzed for Ncaph2I15N/I15N. Error bars indicate SEM. (ns) Nonsignificant with an unpaired t-test. Bar, 10 µm. (E–G) Cleavage plane orientation is not affected in E13.5 Ncaph2I15N/I15N mice. (E) Representative image of mitotic apical progenitors illustrating the normal orientation of the mitotic spindle parallel to the ventricular surface. E13.5 coronal sections and nuclei (DAPI; white) are shown. (Dashed line) Ventricular surface; (dashed circles) mitotic cells; (double-sided arrows) the axis of the mitotic spindle and position of mitotic centrosomes (identified by Aurora A immunostaining). Bar, 10 µm. (F) Schematic outlining measurement of the mitotic spindle axis, defined as the angle between the spindle line vector and the reference plane for the ventricular surface. Green circles indicate centrosomes, and red circles point to where the spindle line vector intersects the plane of the ventricular surface. (G) Quantification of mitotic spindle orientation in apical neural progenitors at metaphase and anaphase in E13.5 neuroepithelium. Data for Ncaph2I15N/+ mice (black circles; mean angle 11°; n = 150 cells from three brains) and Ncaph2I15N/I15N mice (red circles; mean angle 12°; n = 159 cells from three brains) are shown. Error bars indicate SD. P = 0.56 with an unpaired t-test. (H–J) Chromosome segregation is impaired in E13.5 Ncaph2I15N/I15N apical neural progenitors. (H,I) Representative images of chromatin bridges in anaphase apical progenitor cells. Three-dimensional reconstructions (DAPI stain in red; anaphase cell DNA highlighted in white; bar, 4 µm) (H) and two-dimensional DAPI-stained confocal sections (bar, 5 µm) (I) from E13.5 coronal sections. (J) Quantification of chromatin bridges observed in apical progenitors of E13.5 Ncaph2I15N/+ and Ncaph2I15N/I15N mice. Significantly increased numbers of mid and late anaphase cells with chromatin bridges are observed in Ncaph2I15N/I15N mice (n = 46 cells from three brains) compared with Ncaph2I15N/+ mice (n = 72 cells from three brains). Error bars indicate SEM. Two-tailed t-test, P = 0.02 versus Ncaph2I15N/+ mice. (K) Model: During early neurogenesis, neural stem cells divide symmetrically to enlarge the pool of neural progenitors. Mitosis occurs at the ventricular surface, with the axis of the mitotic spindle parallel to this surface. This ensures that the cleavage furrow is perpendicular and that, consequently, basal fate determinants (indicated by green bar) segregate equally between daughter cells, ensuring retention of stem cell identity. (Middle panel) The mitotic spindle fails to align when genes encoding centrosomal proteins are mutated (ASPM, CDK5RAP2, MCPH1, and CPAP), leading to oblique cell cleavage events that result in premature asymmetric cell division. Daughter neuron cells are produced, and expansion of the neural stem cell pool is decreased, consequently reducing the total number of neurons. (Right panel) In contrast, condensin mutations lead to chromatin bridges during neurogenesis, with unaltered spindle orientation. Such chromosome segregation errors would be expected to reduce cell proliferation and survival, depleting the neuronal number generated during neurogenesis.

