Figure 5.
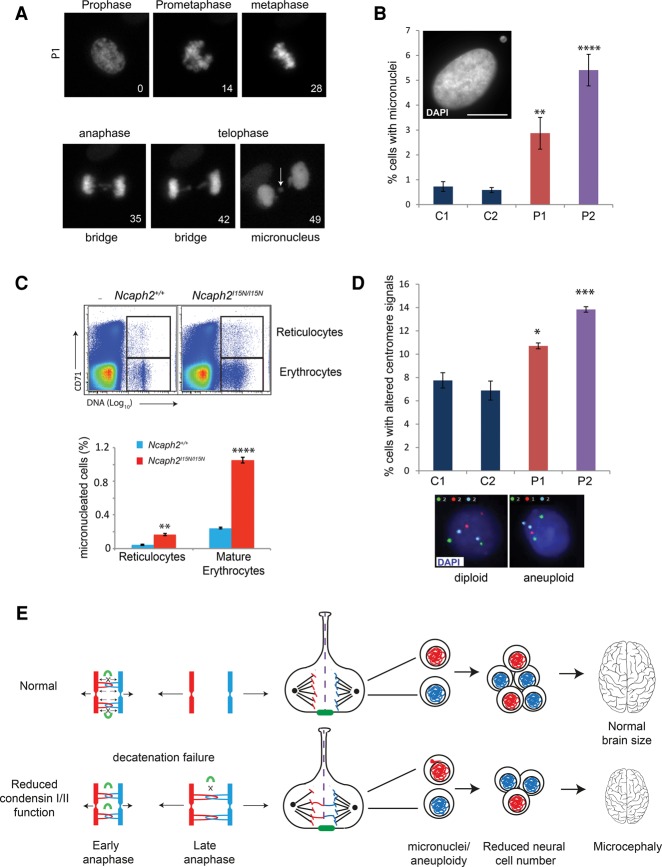
Decatenation failure results in micronuclei and aneuploidy in condensin mouse and patient cells. (A) Live-imaging stills of chromatin bridge and subsequent micronucleus formation in a patient P1 fibroblast cell. DNA visualized by transient expression of RFP-tagged histone 2B. Time is shown in minutes from nuclear envelope breakdown. The arrow indicates the position of the micronucleus. (B) NCAPD2 patient P1 and NCAPD3 patient P2 fibroblasts have significantly elevated levels of micronuclei. The percentage of micronucleus-positive cells was quantified (experiments = 5, n > 500 cells). Error bars indicate SEM. Two-tailed t-test, (**) P ≤ 0.01; (****) P ≤ 0.0001 versus C1. (Inset) Representative picture of a patient P2 fibroblast cell with a micronucleus (shown in the top left corner). Bar, 10 µm. (C) Elevated frequency of micronuclei in peripheral blood of Ncaph2I15N/I15N mice. (Top panel) Representative FACS plots of CD71 (reticuloctyte marker) versus propidium iodide (DNA content) of Ncaph2I15N/I15N and Ncaph2+/+ adult mice demonstrating gating strategy. Gated cells have subdiploid DNA content (micronuclei). (Top gate) Micronuclei in CD71+ve reticulocytes. (Bottom gate) Micronuclei in mature erythrocytes. In contrast to the usual linear scale for DNA content FACS plots, the DNA axis is presented on a log10 scale, with fully nucleated cells off the scale, and micronucleated cells appearing to the right of enucleated cells within the gates indicated by the boxed regions. (Right panel) Quantification of flow cytometry analysis of micronuclei in the peripheral blood reticulocytes and mature erythrocytes of Ncaph2I15N/I15N and Ncaph2+/+ adult mice. N = 3. Error bars indicate SEM. Two-tailed t-test, (**) P ≤ 0.01; (****) P ≤ 0.0001 versus Ncaph2+/+ mice. (D) Levels of aneuploidy are significantly increased in NCAPD2 patient P1 and NCAPD3 patient P2 fibroblasts. (Top panel) Quantification of the percentage of cells with numerical chromosome imbalances detected by interphase FISH. Bars indicate the average of two sets of probes detecting chromosome 3, 7, and 18 and 4, 10, and 17, respectively. n > 700 cells; experiments ≥ 4. Error bars indicate SEM. Two-tailed t-test, (*) P ≤ 0.05; (***) P ≤ 0.001 versus C1. (Bottom panel) Representative images of interphase FISH of chromosomes 4 (green), 10 (red), and 17 (aqua) in primary fibroblasts. (E) Model: Decatenation failure in condensin-deficient neural stem cells reduces brain size through a reduction in cell number generated during neurogenesis. Impaired mitotic chromosome compaction in condensin-deficient neural stem cells decreases tension in catenated DNA, reducing topoisomerase IIα DNA strand exchange activity (topoisomerase IIα enzyme indicated by green curved line). This delays decatenation of DNA between sister chromatids, leading to increased chromosome segregation errors and subsequent aneuploidy/micronucleus formation. Anueploidy in condensin-deficient neural stem cells is likely to reduce cell number by impaired proliferation potential (Gogendeau et al. 2015) and/or reduced cell survival (Marthiens et al. 2013; Nishide and Hirano 2014) during the restricted developmental window of neurogenesis.

