Figure 7.
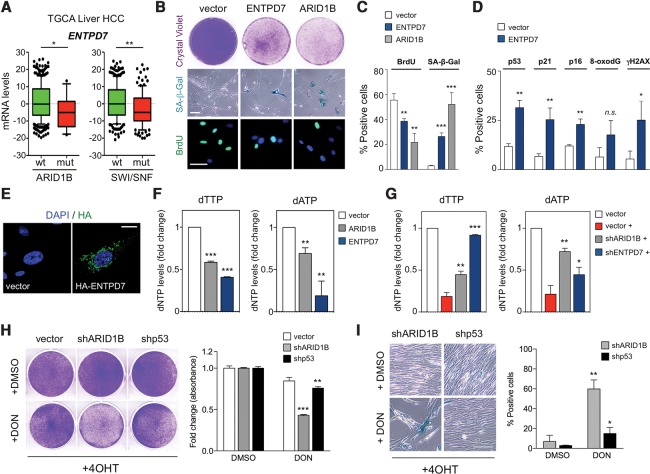
ARID1B-deficient cells are sensitive to alterations in nucleotide metabolism. (A) ENTPD7 differential expression between SWI/SNF or ARID1B mutant/wild-type samples was calculated using Student's t-test (details are in the Materials and Methods) using The Cancer Genome Atlas Liver Hepatocellular Carcinoma data set. (B) Colony formation assay (top), SA-β-Gal staining (middle), and BrdU IF (bottom) of IMR90 transduced with an empty vector or cDNA of ARID1B or ENTPD7. Bar, 30 μm. (C) Quantification by HCA of BrdU IF and SA-β-Gal staining is shown. n = 3. (D) Quantification by HCA of IF staining for p53, p21CIP1, p16INK4a, 8-oxodG, and γH2AX in IMR90 cells transduced with ENTPD7 cDNA or empty vector. n = 3. (E) Representative images of HA tag IF staining of IMR90 cells transduced with either an empty vector or an HA-tagged ENTPD7 cDNA. DAPI was used to visualize the nuclei. Bar, 10 μm. (F) IMR90 cells were transduced with either an empty vector, ARID1B cDNA, or ENTPD7 cDNA, and then intracellular dNTP levels were measured. (G) IMR90 ER:RAS cells were transduced with either an empty vector, an ARID1B shRNA, or an ENTPD7 shRNA and induced to undergo senescence by 4OHT treatment (+). Intracellular dNTP levels were measured 5 d after 4OHT. (H,I) Cell growth assay (H, crystal violet) and SA-β-Gal staining (I) of stable ARID1B knockdown, p53 knockdown, or control IMR90 ER:RAS cells treated with 4OHT followed by 5 µM 6-diazo-5-oxo-L-norleucine (DON) or DMSO. For H and I, the left panels show representative images, and the right panels show quantification. Graphs represent mean ± SD from n = 2 (H) and n = 3 (F,G,I). (***) P < 0.001; (**) P < 0.005; (*) P < 0.05; (n.s.) nonsignificant by two-tailed Student t-test.

